Smart Buoy — Waterproofing, Dashboards and Deploy 🚱📊
A tech focused education and services company.
This Smart Buoy series charts our (ambitious) attempt to build a scientific buoy that can take meaningful measurements about the sea using off-the-shelf products. This is our final tutorial— make sure you’re up to date, and if you need a swift introduction to the project, check out our summary.
Part 1: Making wave and temperature measurements
Part 2: GPS, Radio (NRF24) and SD Card Module
Part 3: Scheduling Power to the Buoy
In this article, we show you how we designed the casing to protect our Smart Buoy from water, waves and shark attacks. We also explain how we connected it to the base station, which hosted a database and interactive dashboard to explore data in real time.
Supplies
As this is the final stage for the project, you’re going to need ALL the supplies:
Arduino Nano — Amazon
Raspberry Pi Zero — Amazon
Battery (18650) — Amazon
Solar panels — Amazon
Blocking Diodes — Amazon
Charge controller — Amazon
Buck booster — Amazon
GPS module — Amazon
GY-86 (accelerometer, gyroscope, barometer, compass) — Amazon
Water Temperature sensor — Amazon
Power monitor module — Amazon
Real time clock module — Amazon
Radio modules — Amazon
i²c multiplexer module — Amazon
3D printer — Amazon
PETG filament — Amazon
Epoxy — Amazon
Primer spray paint — Amazon
Rope — Amazon
Floats — Amazon
Glue — Amazon
🔗 Get The Smart Buoy Code On Github 📔
Tutorial 🤖
Casing — Buoy
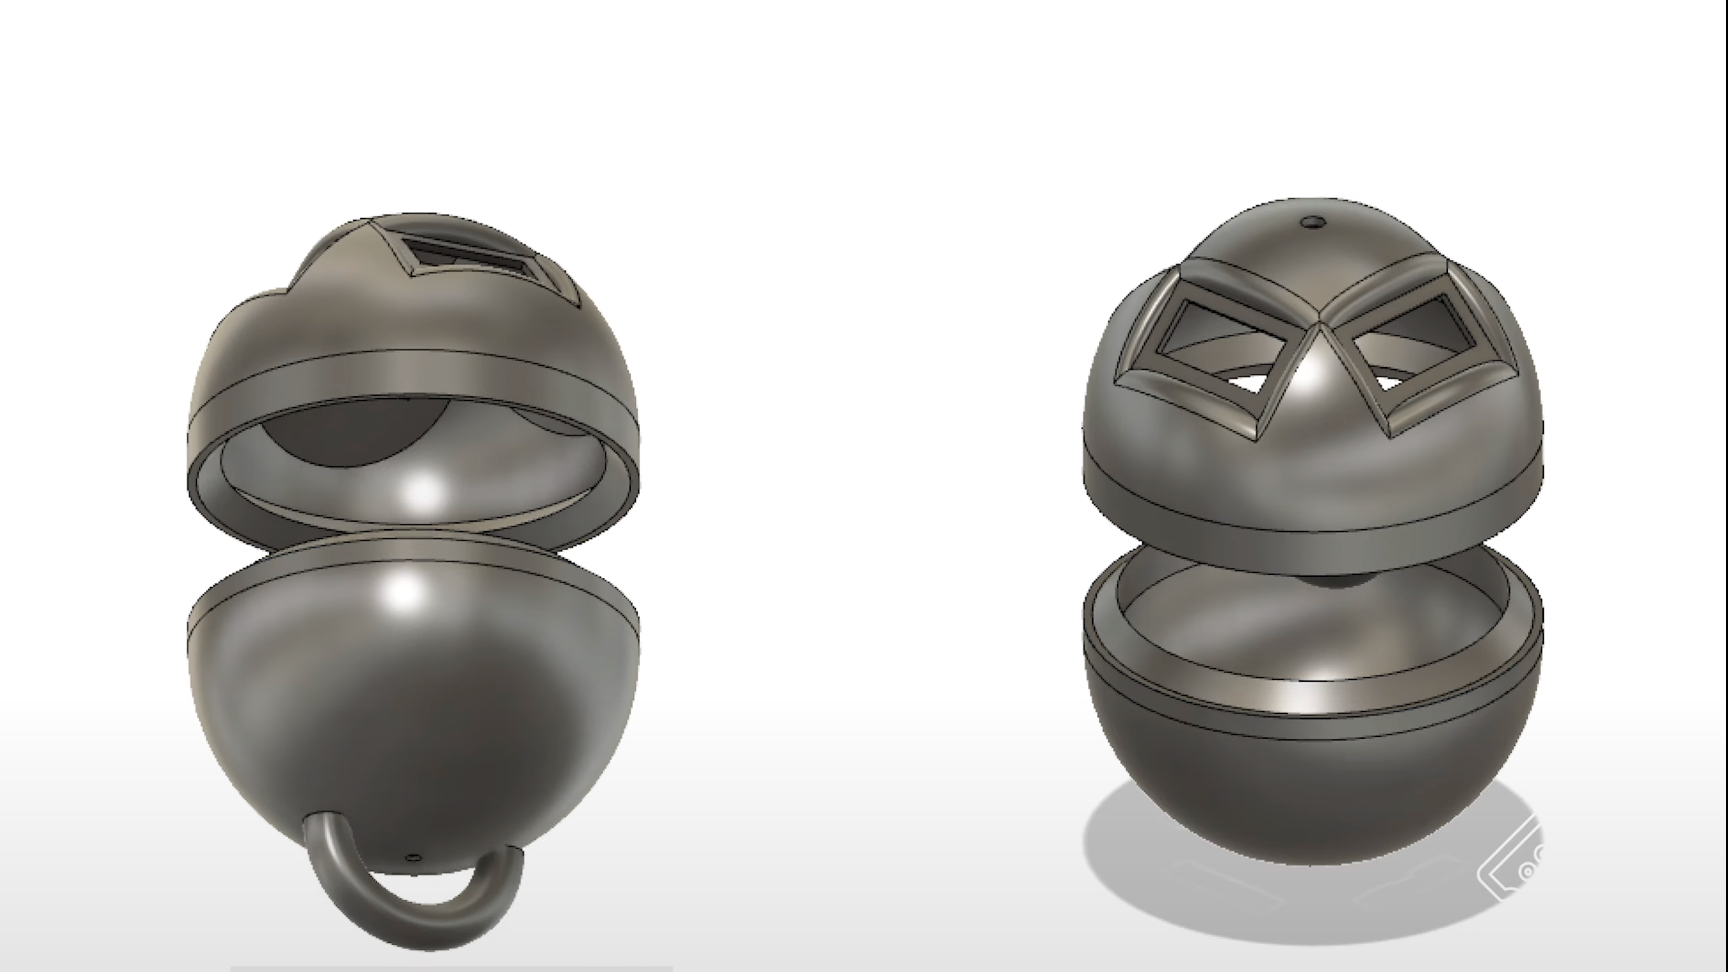
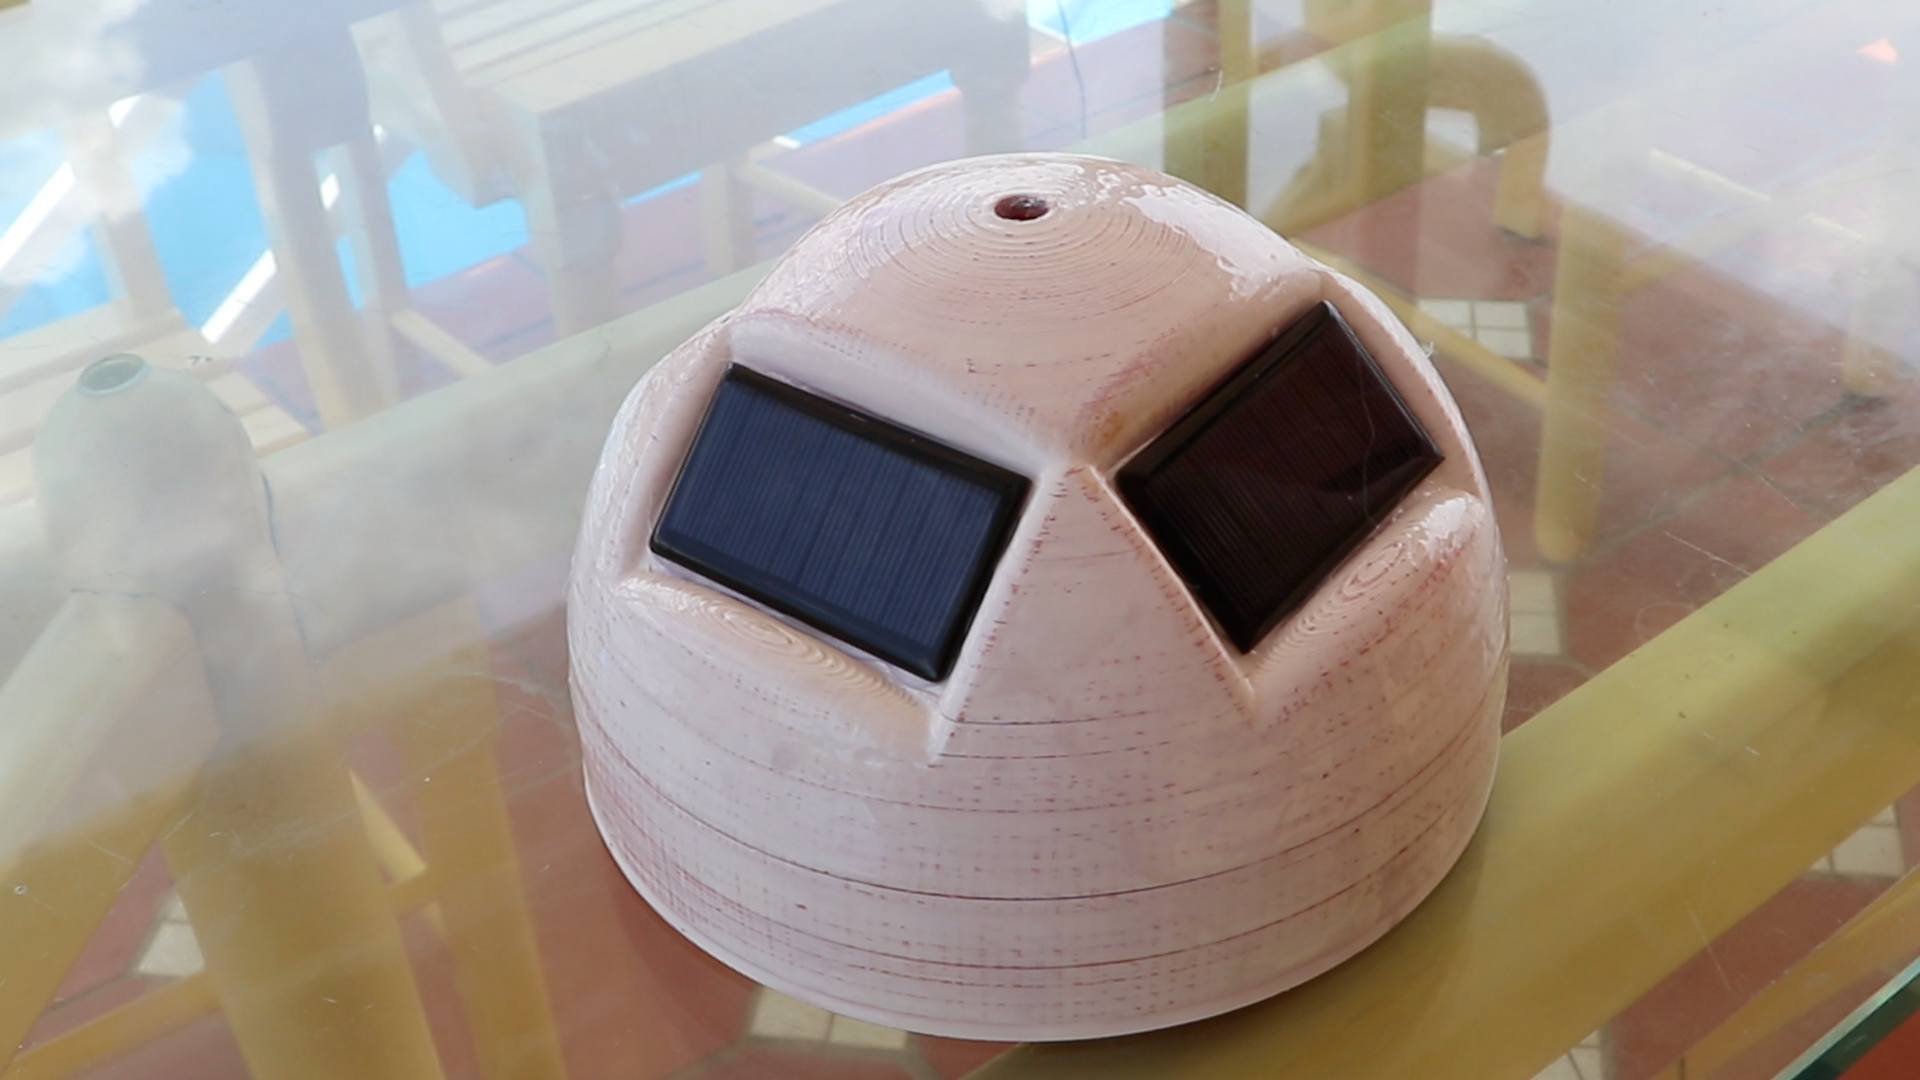
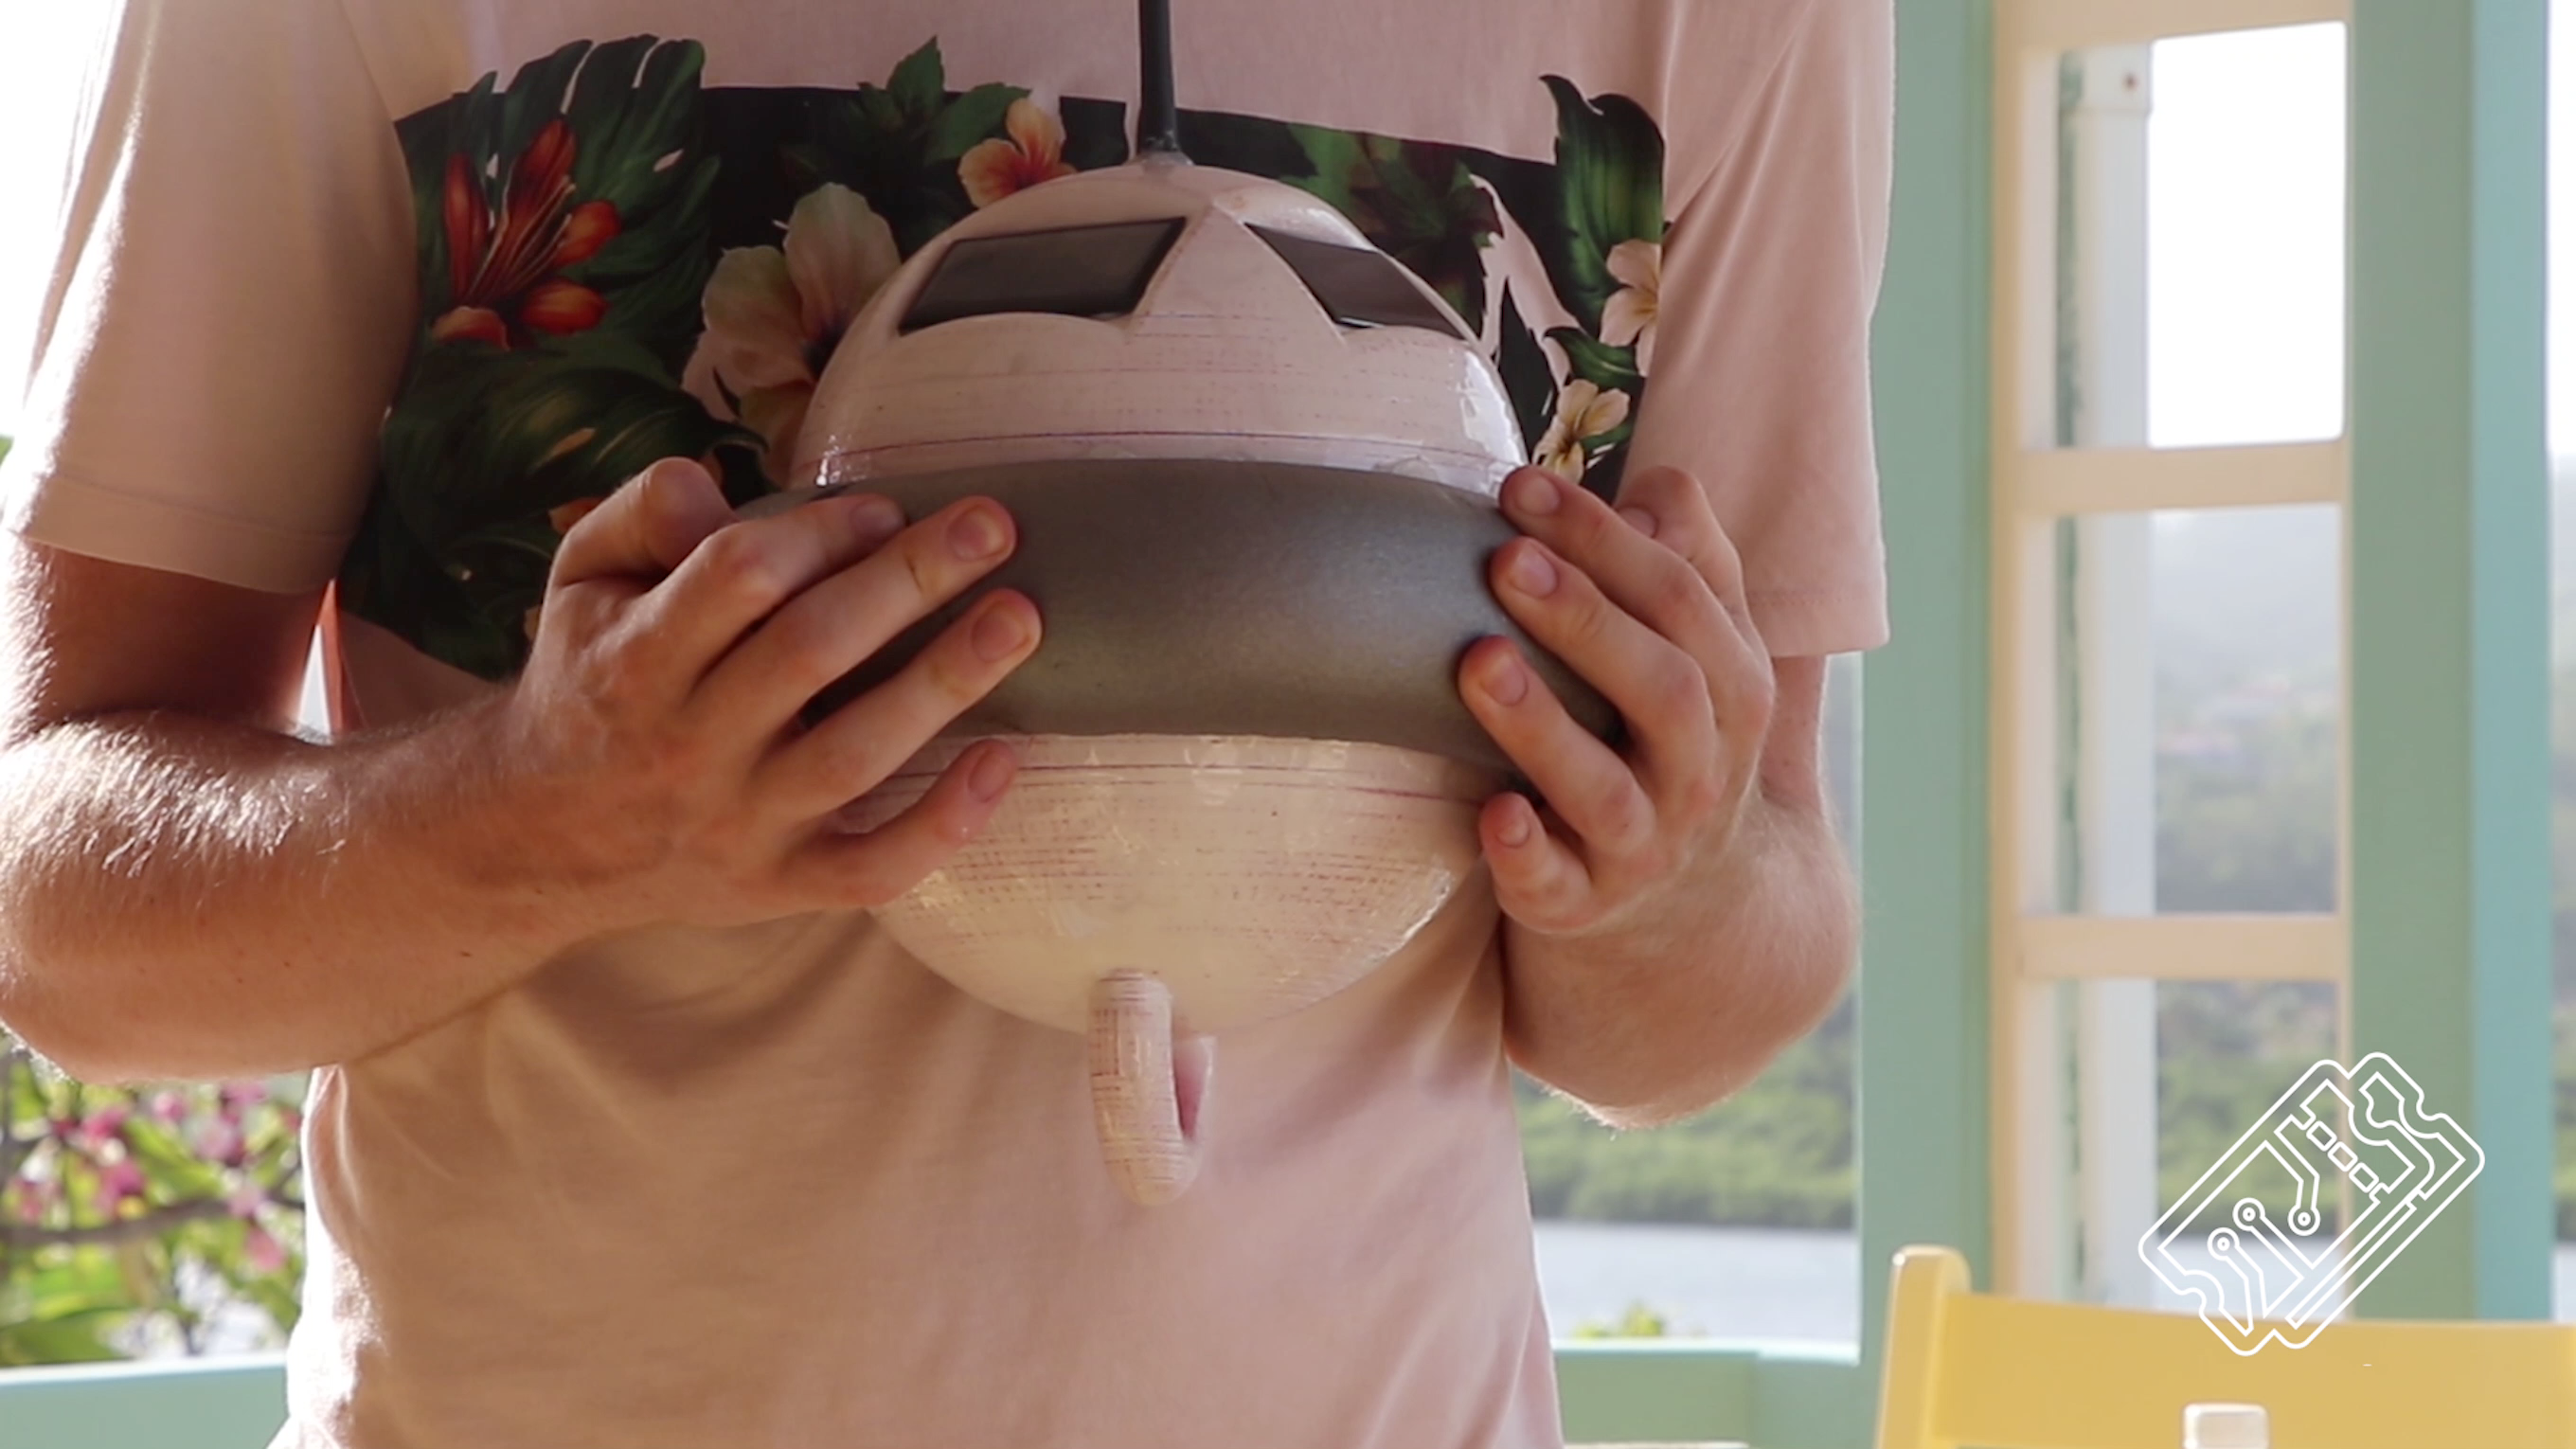
When we designed the Buoy, we had a couple of key things in mind: it needed to fit all the electronics inside, have slots for the solar panels, radio aerial and water temperature sensor. It also needed(!!) to be watertight and float. It also required an anchor point, so it wouldn’t just float away.
We used Autodesk Fusion 360 software to design the Buoy and we’re pretty happy with how it turned out. However, we shot ourselves in the foot slightly by not including a sealable slot for programming the Arduino, and were at the mercy of getting everything working perfectly before we glued it together.
Casing — Base station
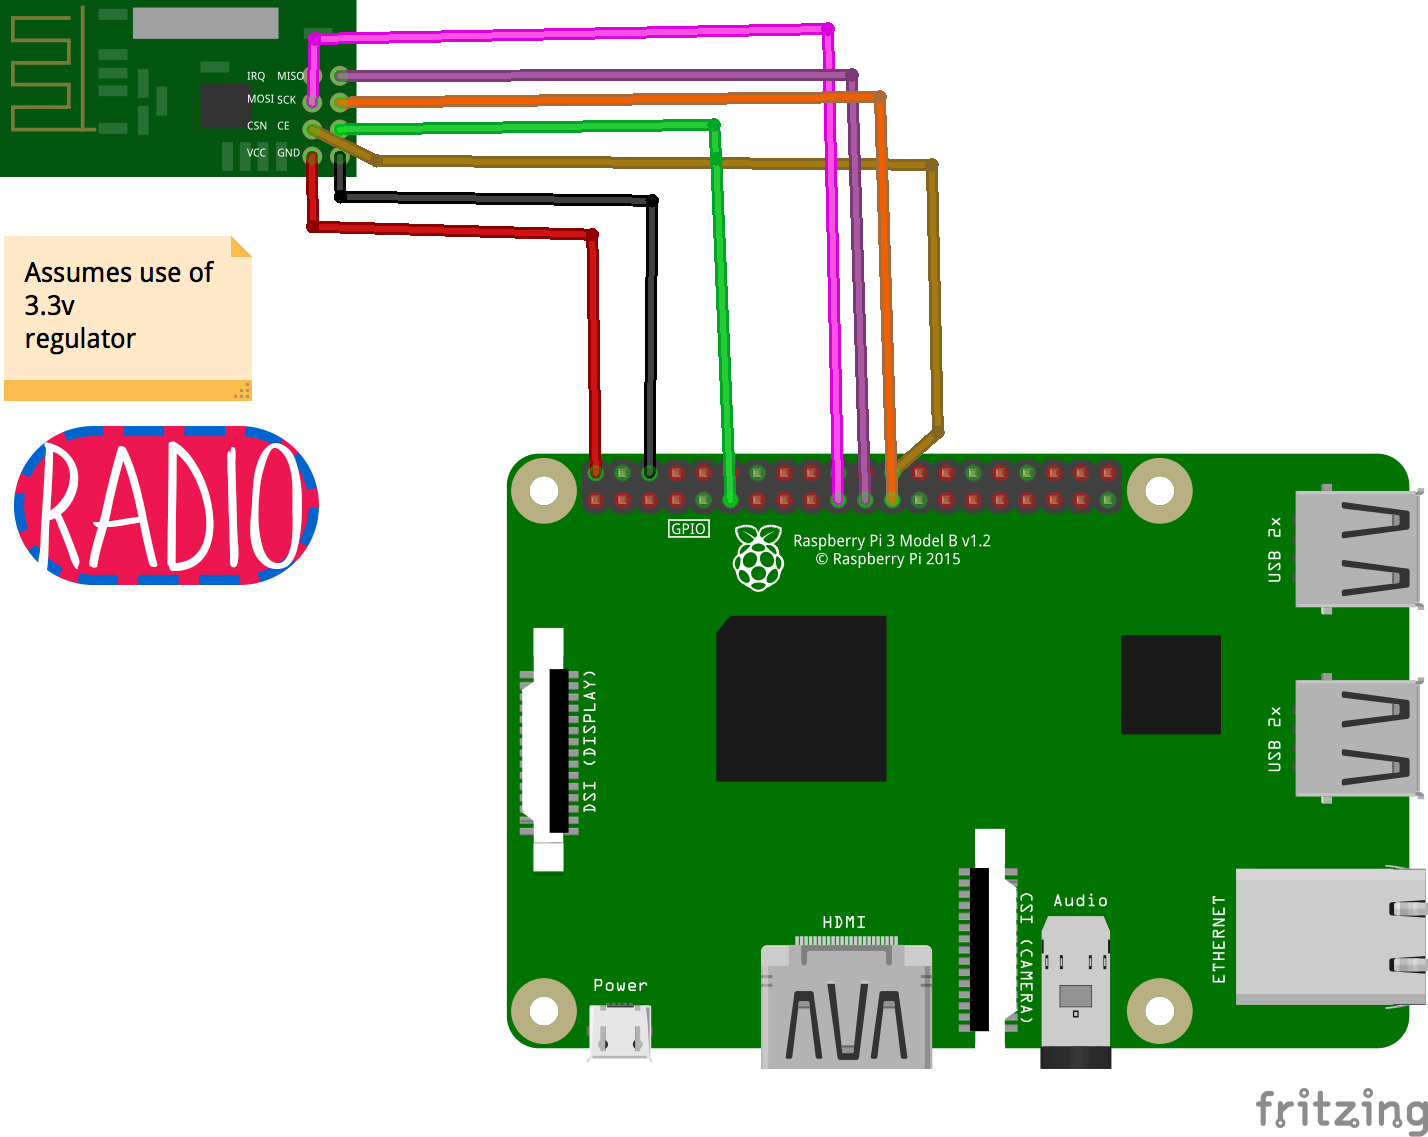
The Buoy communicated via radio and the messages were received by a base station. In the previous tutorials, we used the radio module with an Arduino for simplicity. The base station used a Raspberry Pi, which connected in the same way but allowed for much more processing.
There are many great open source cases on Thingiverse, including this one that prints in one piece and has cut outs for wiring.
](https://cdn-images-1.medium.com/max/2000/1*aTp2RK2FGBSIa1kR4wClww.jpeg) *
*
One Piece Raspberry Pi Zero Case — Source*
Print — Buoy
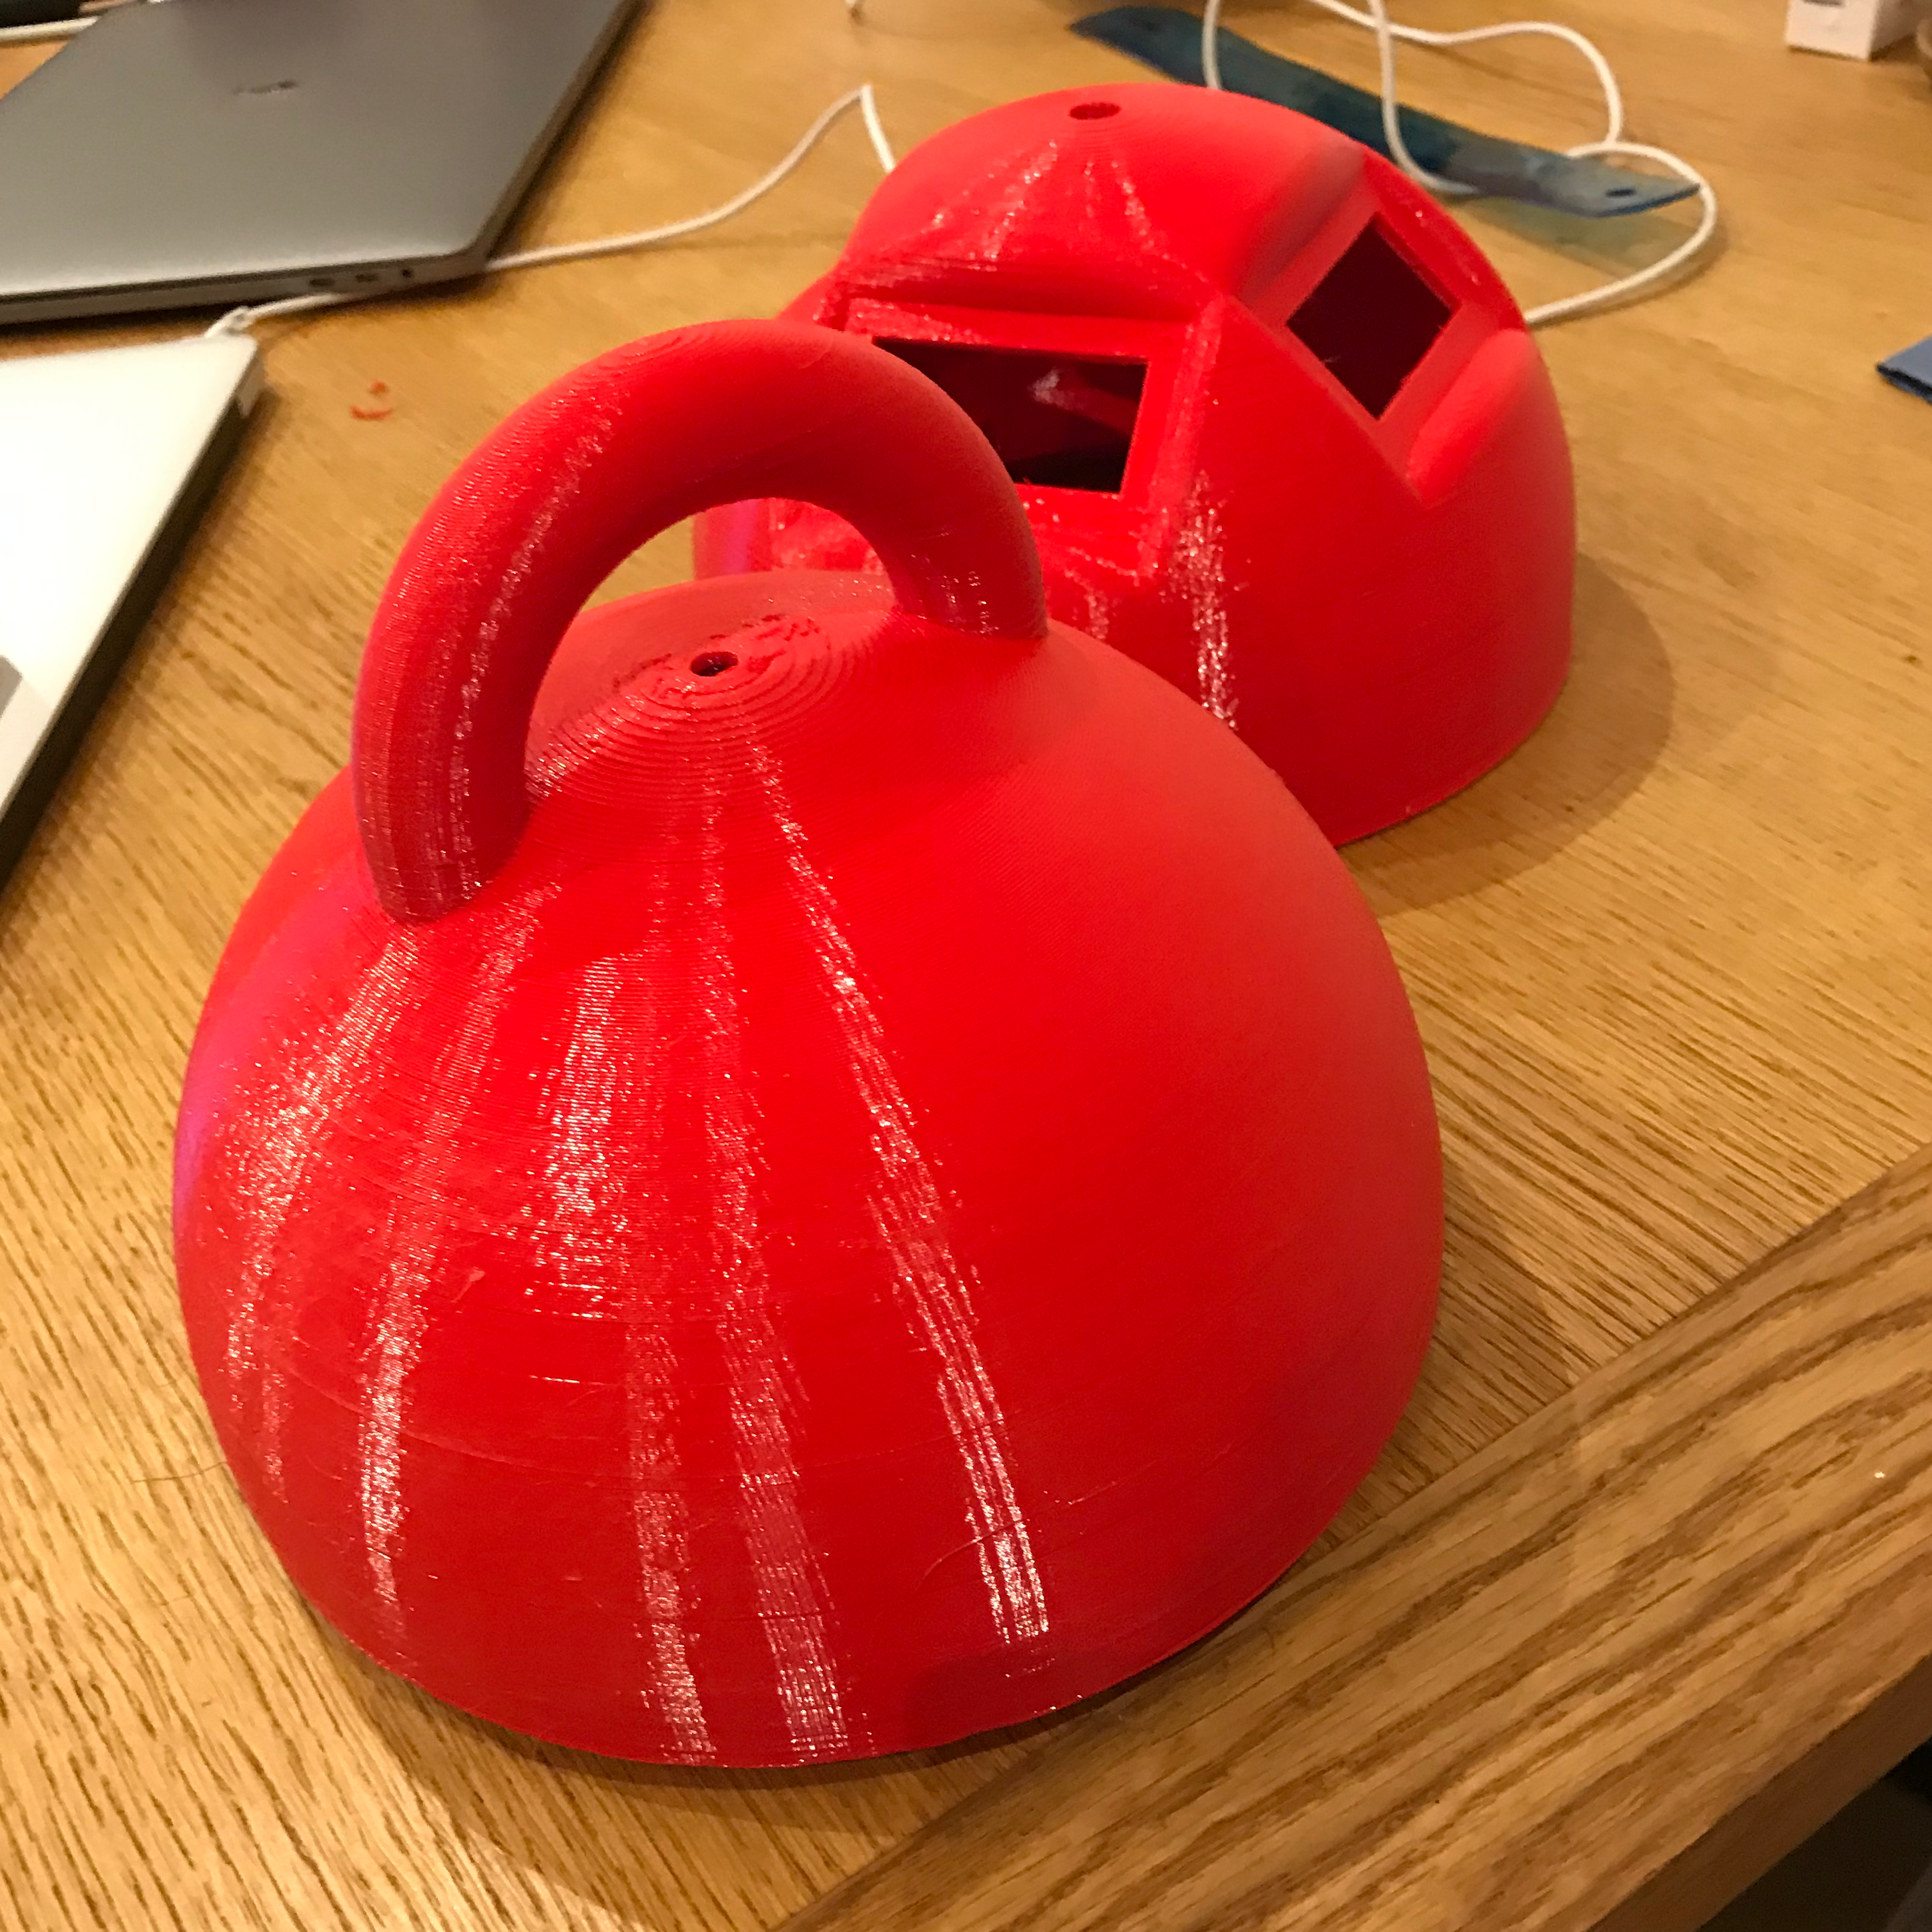
3D printing is great fun but also time consuming and rage-inducing. Luckily, however, some people are much more experienced than we were and were quite helpful. Thanks to reddit user @dbcottonhead, we looked into PETG filament, which is meant to be much more durable and creates stronger shells. These are important things to take into account when making something that is expected to float in a salty sea in 40°C sun, while possibly smashing into some rocks…
To ensure waterproofing, our main focus was on layer adhesion:
Thin layer heights of 0.3mm helped reduce the size of gaps
4 perimeters to reduce possibility of gaps and give wall strength
A completely solid Buoy would be watertight, but it also wouldn't float as the density of PETG is higher than that of water. We chose to have a 15% infill on the print.
Each half took around 24 hours to print and used 500g of PETG. The finished print was quite smooth, but with the stringiness and blobs you would expect when using PETG with FDM printing.
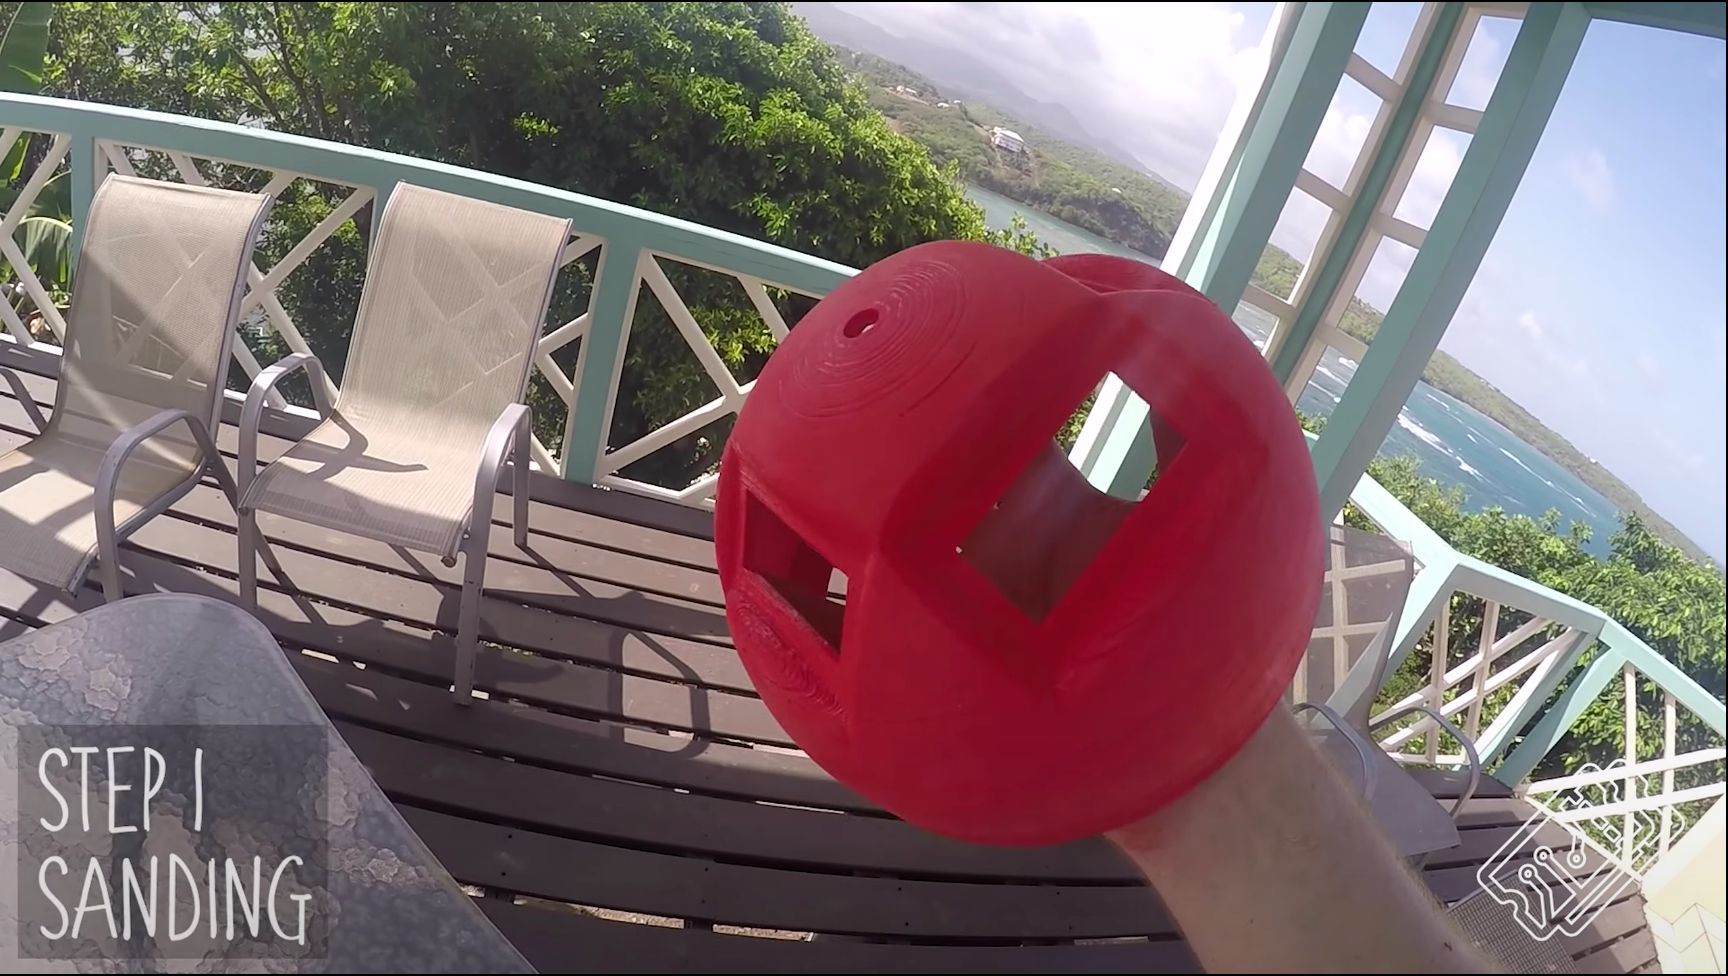
Post-production
Even with careful initial planning and our attempts to improve layer adhesion, the Buoy wasn’t watertight. We started our post-production processing by sanding with various layers of quite rough grit.
We then sprayed over this uniformly rough surface with a few coats of plastic filler primer paint to fill the gaps.
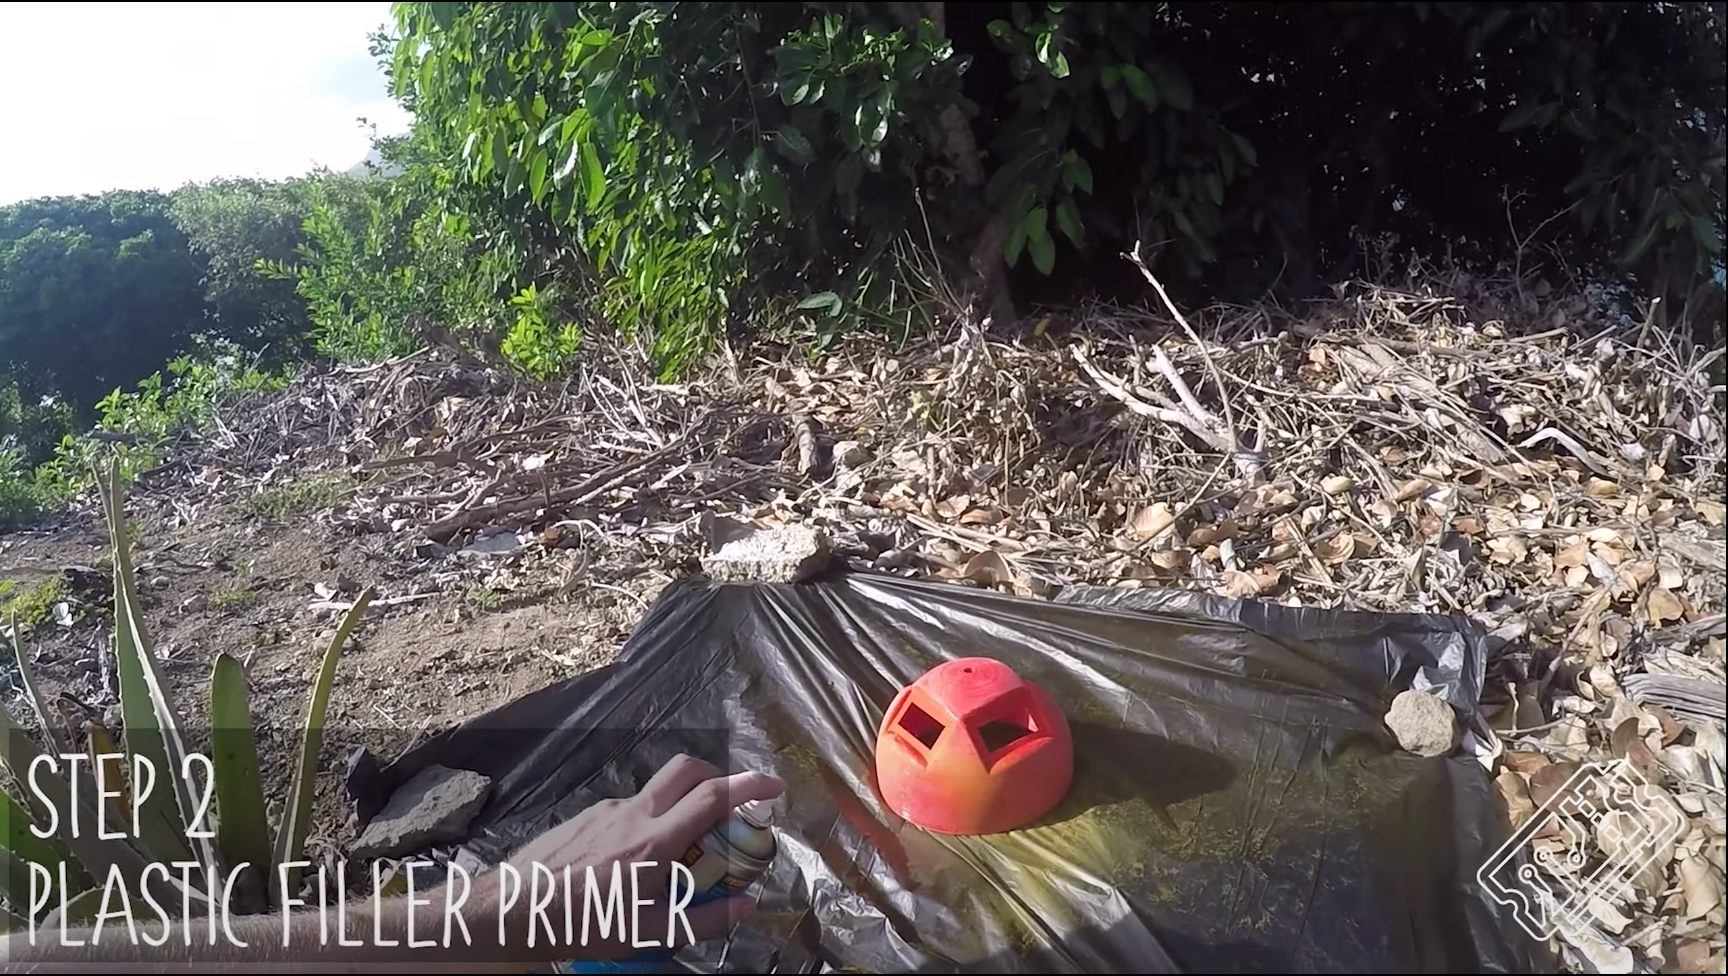
This improved the outer shell, but did not completely remove layer gaps.
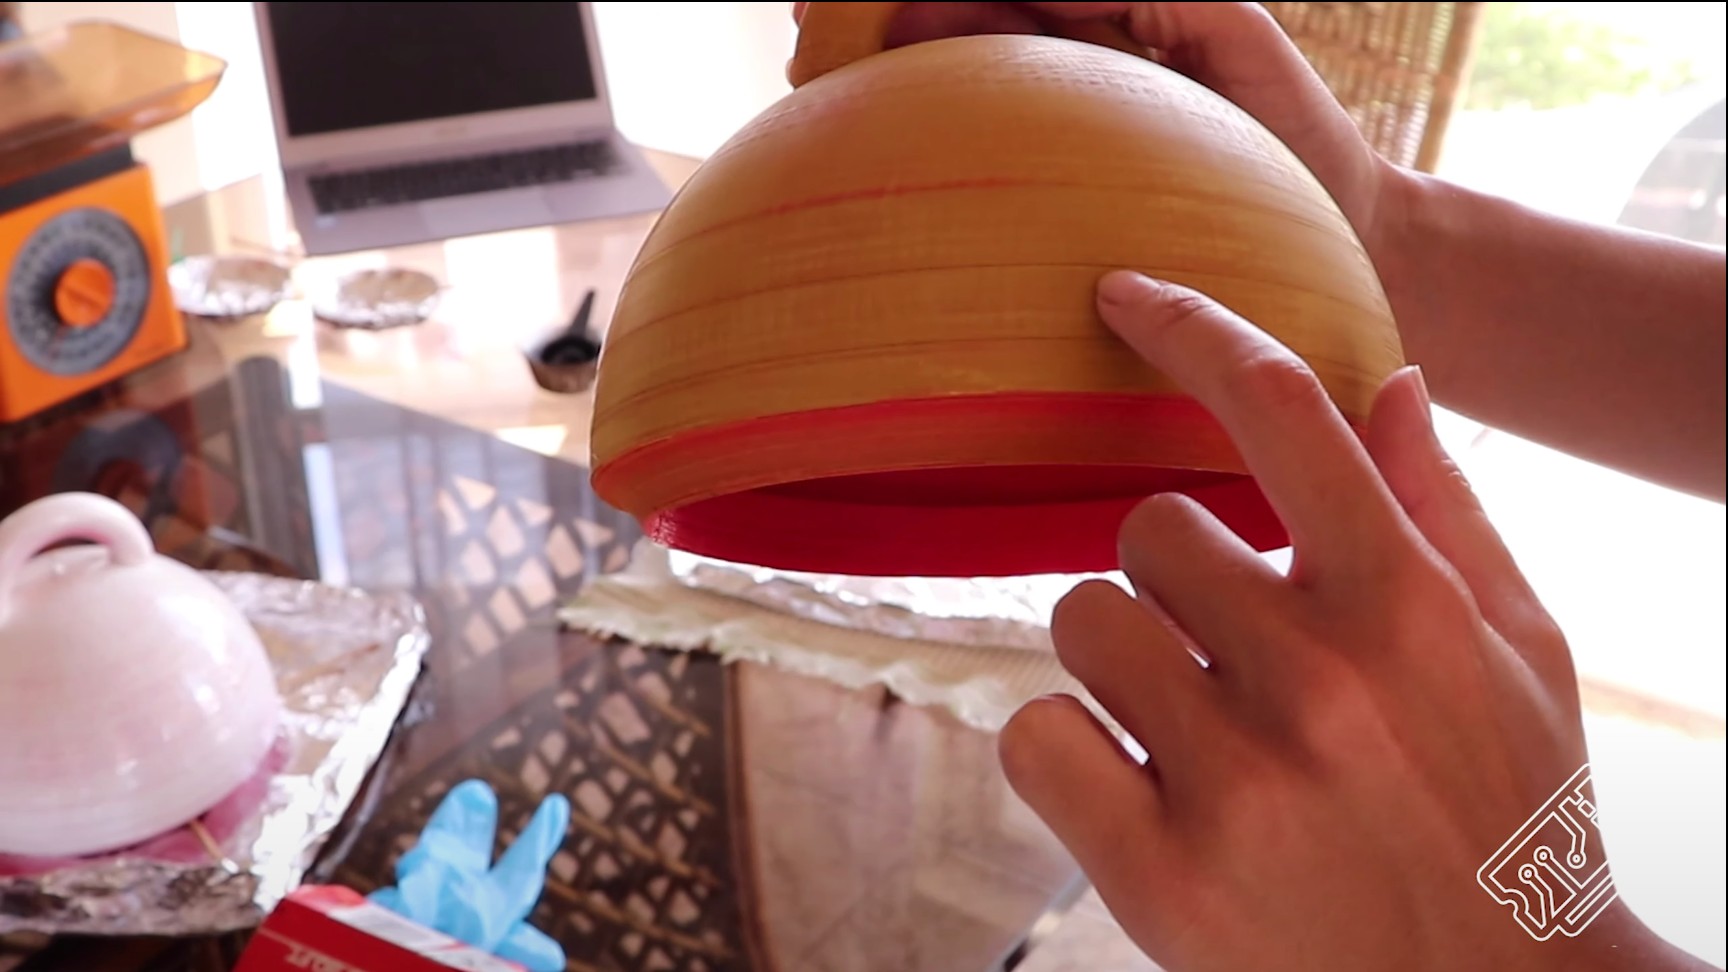
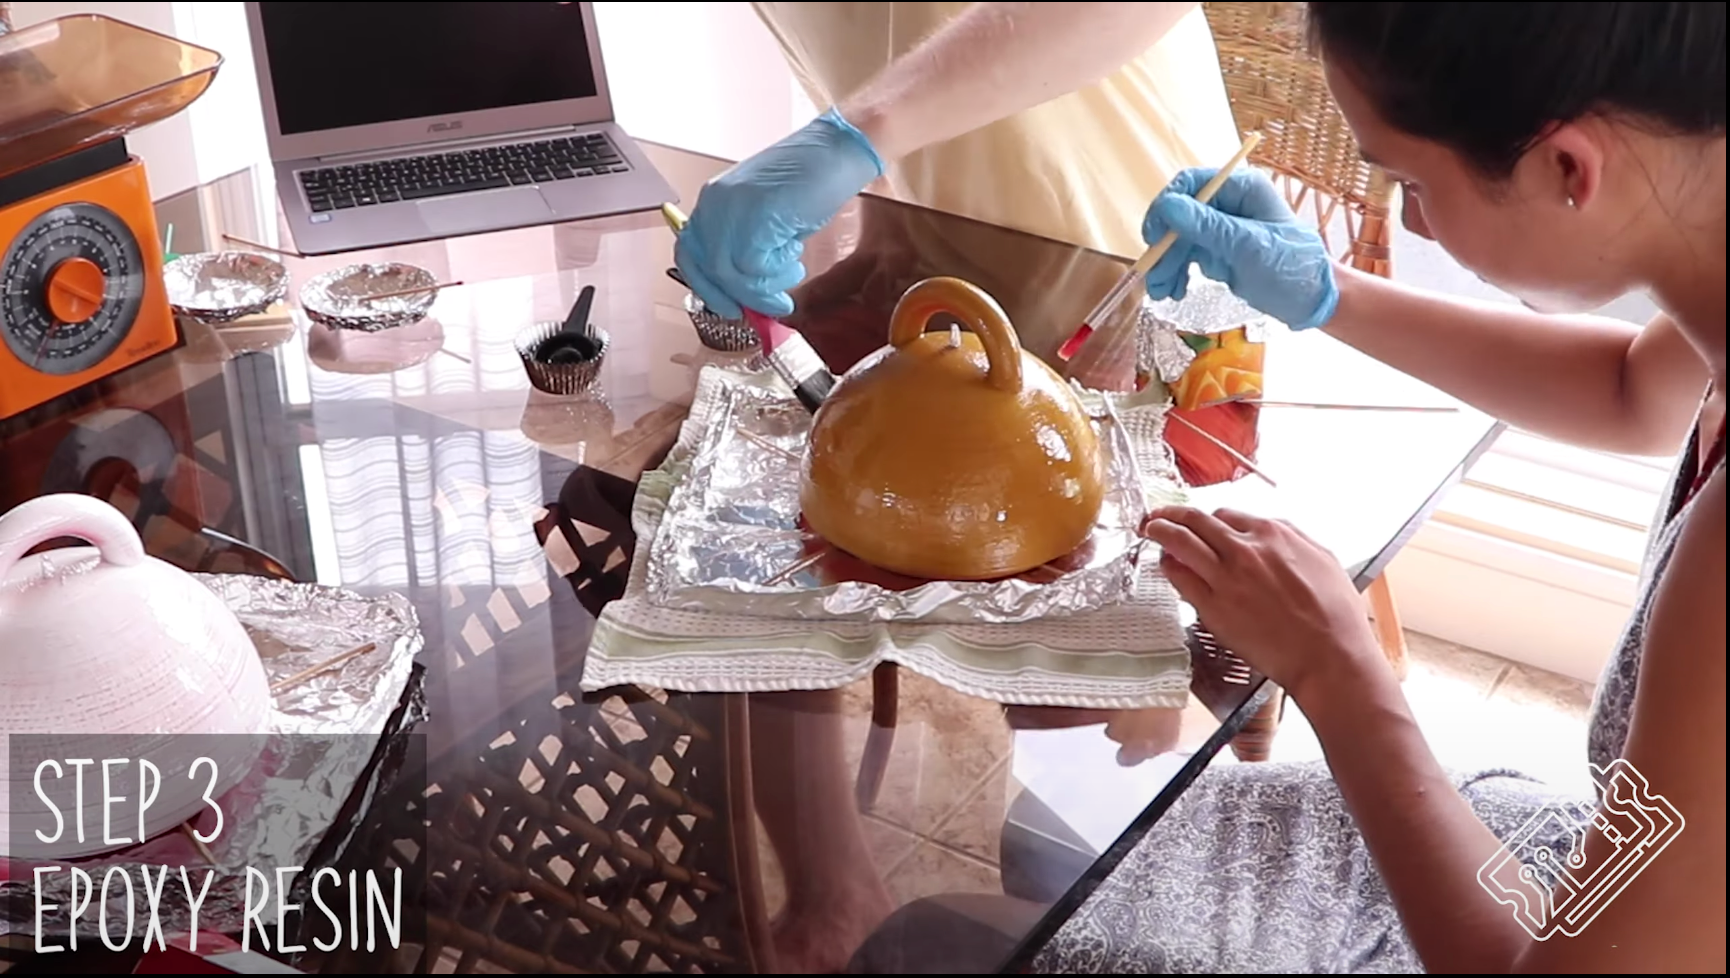
The final resort was to add a few coats of Epoxy resin. Epoxy is very durable and gave the Buoy a slight shine.
Solar Panels
The Smart Buoy featured four solar panels equally spaced around its circumference. Each cell was capable of producing 5V at 60mA. A typical Arduino nano requires ~20mA, so we hoped this would be fine for our system. We soldered wires to the rear of the solar panels and connected to the rest of charging system.
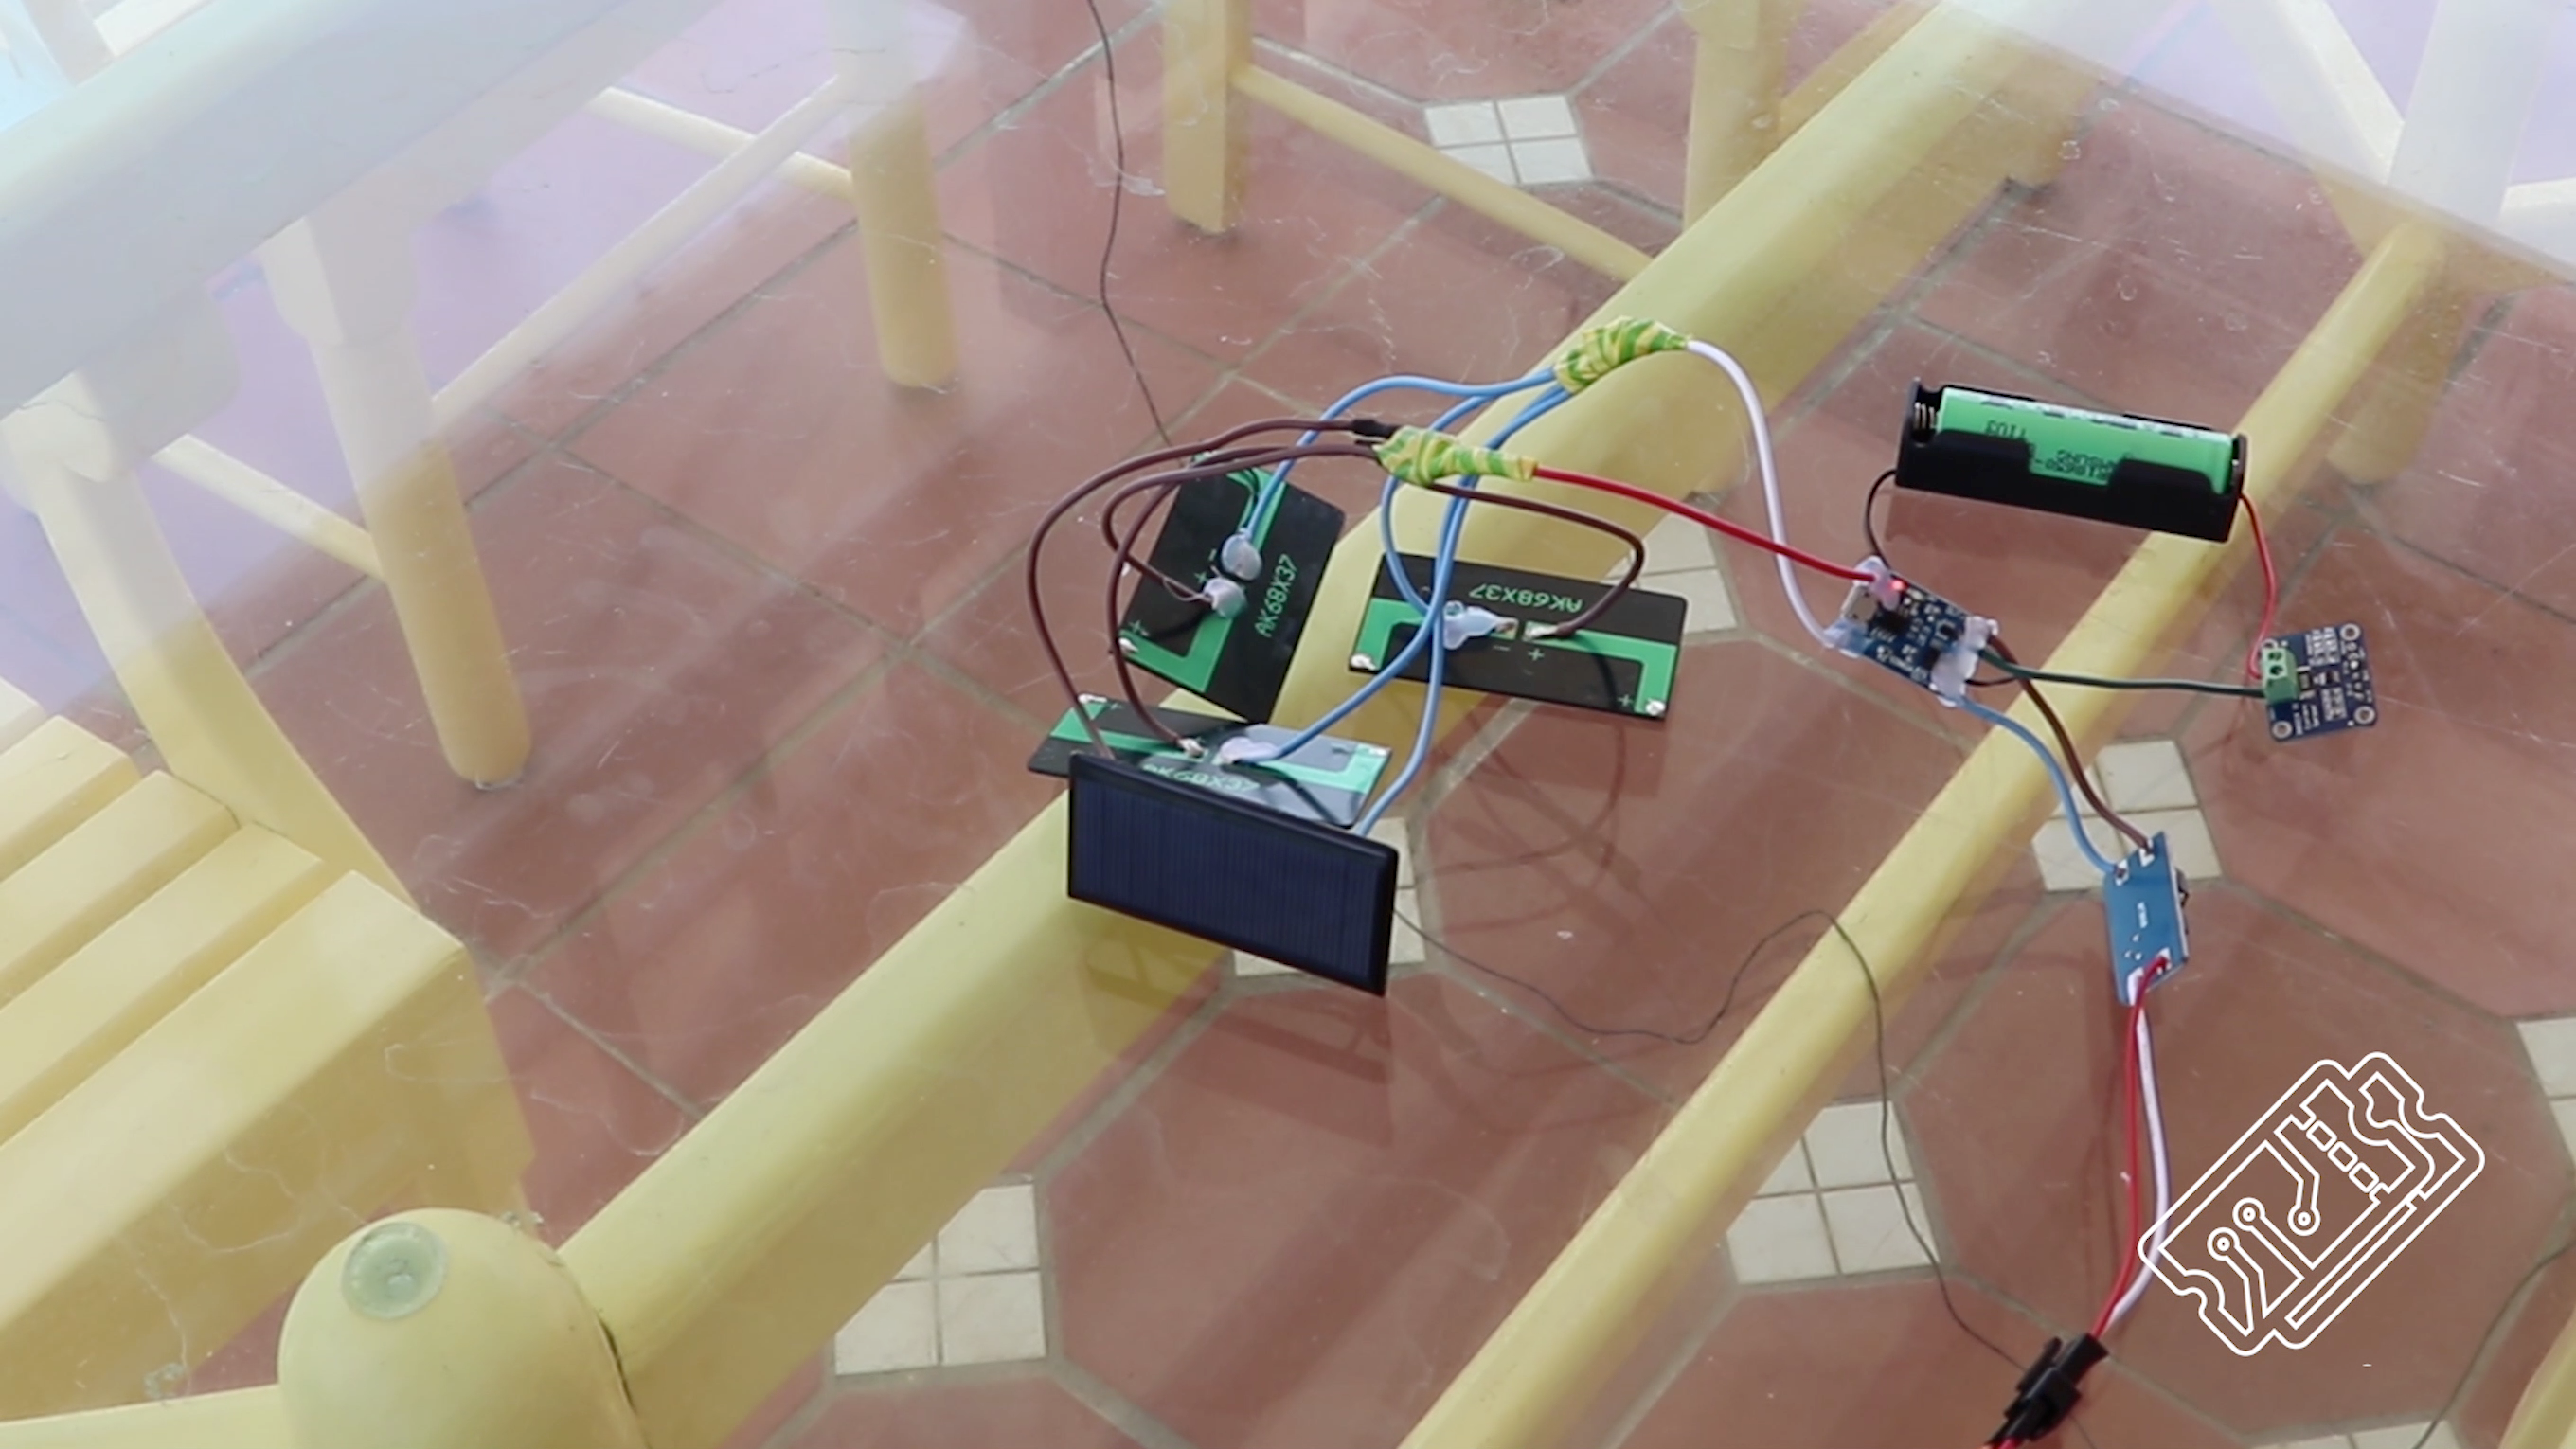
We threaded the wires through and then glued the solar panels into water-tight position.
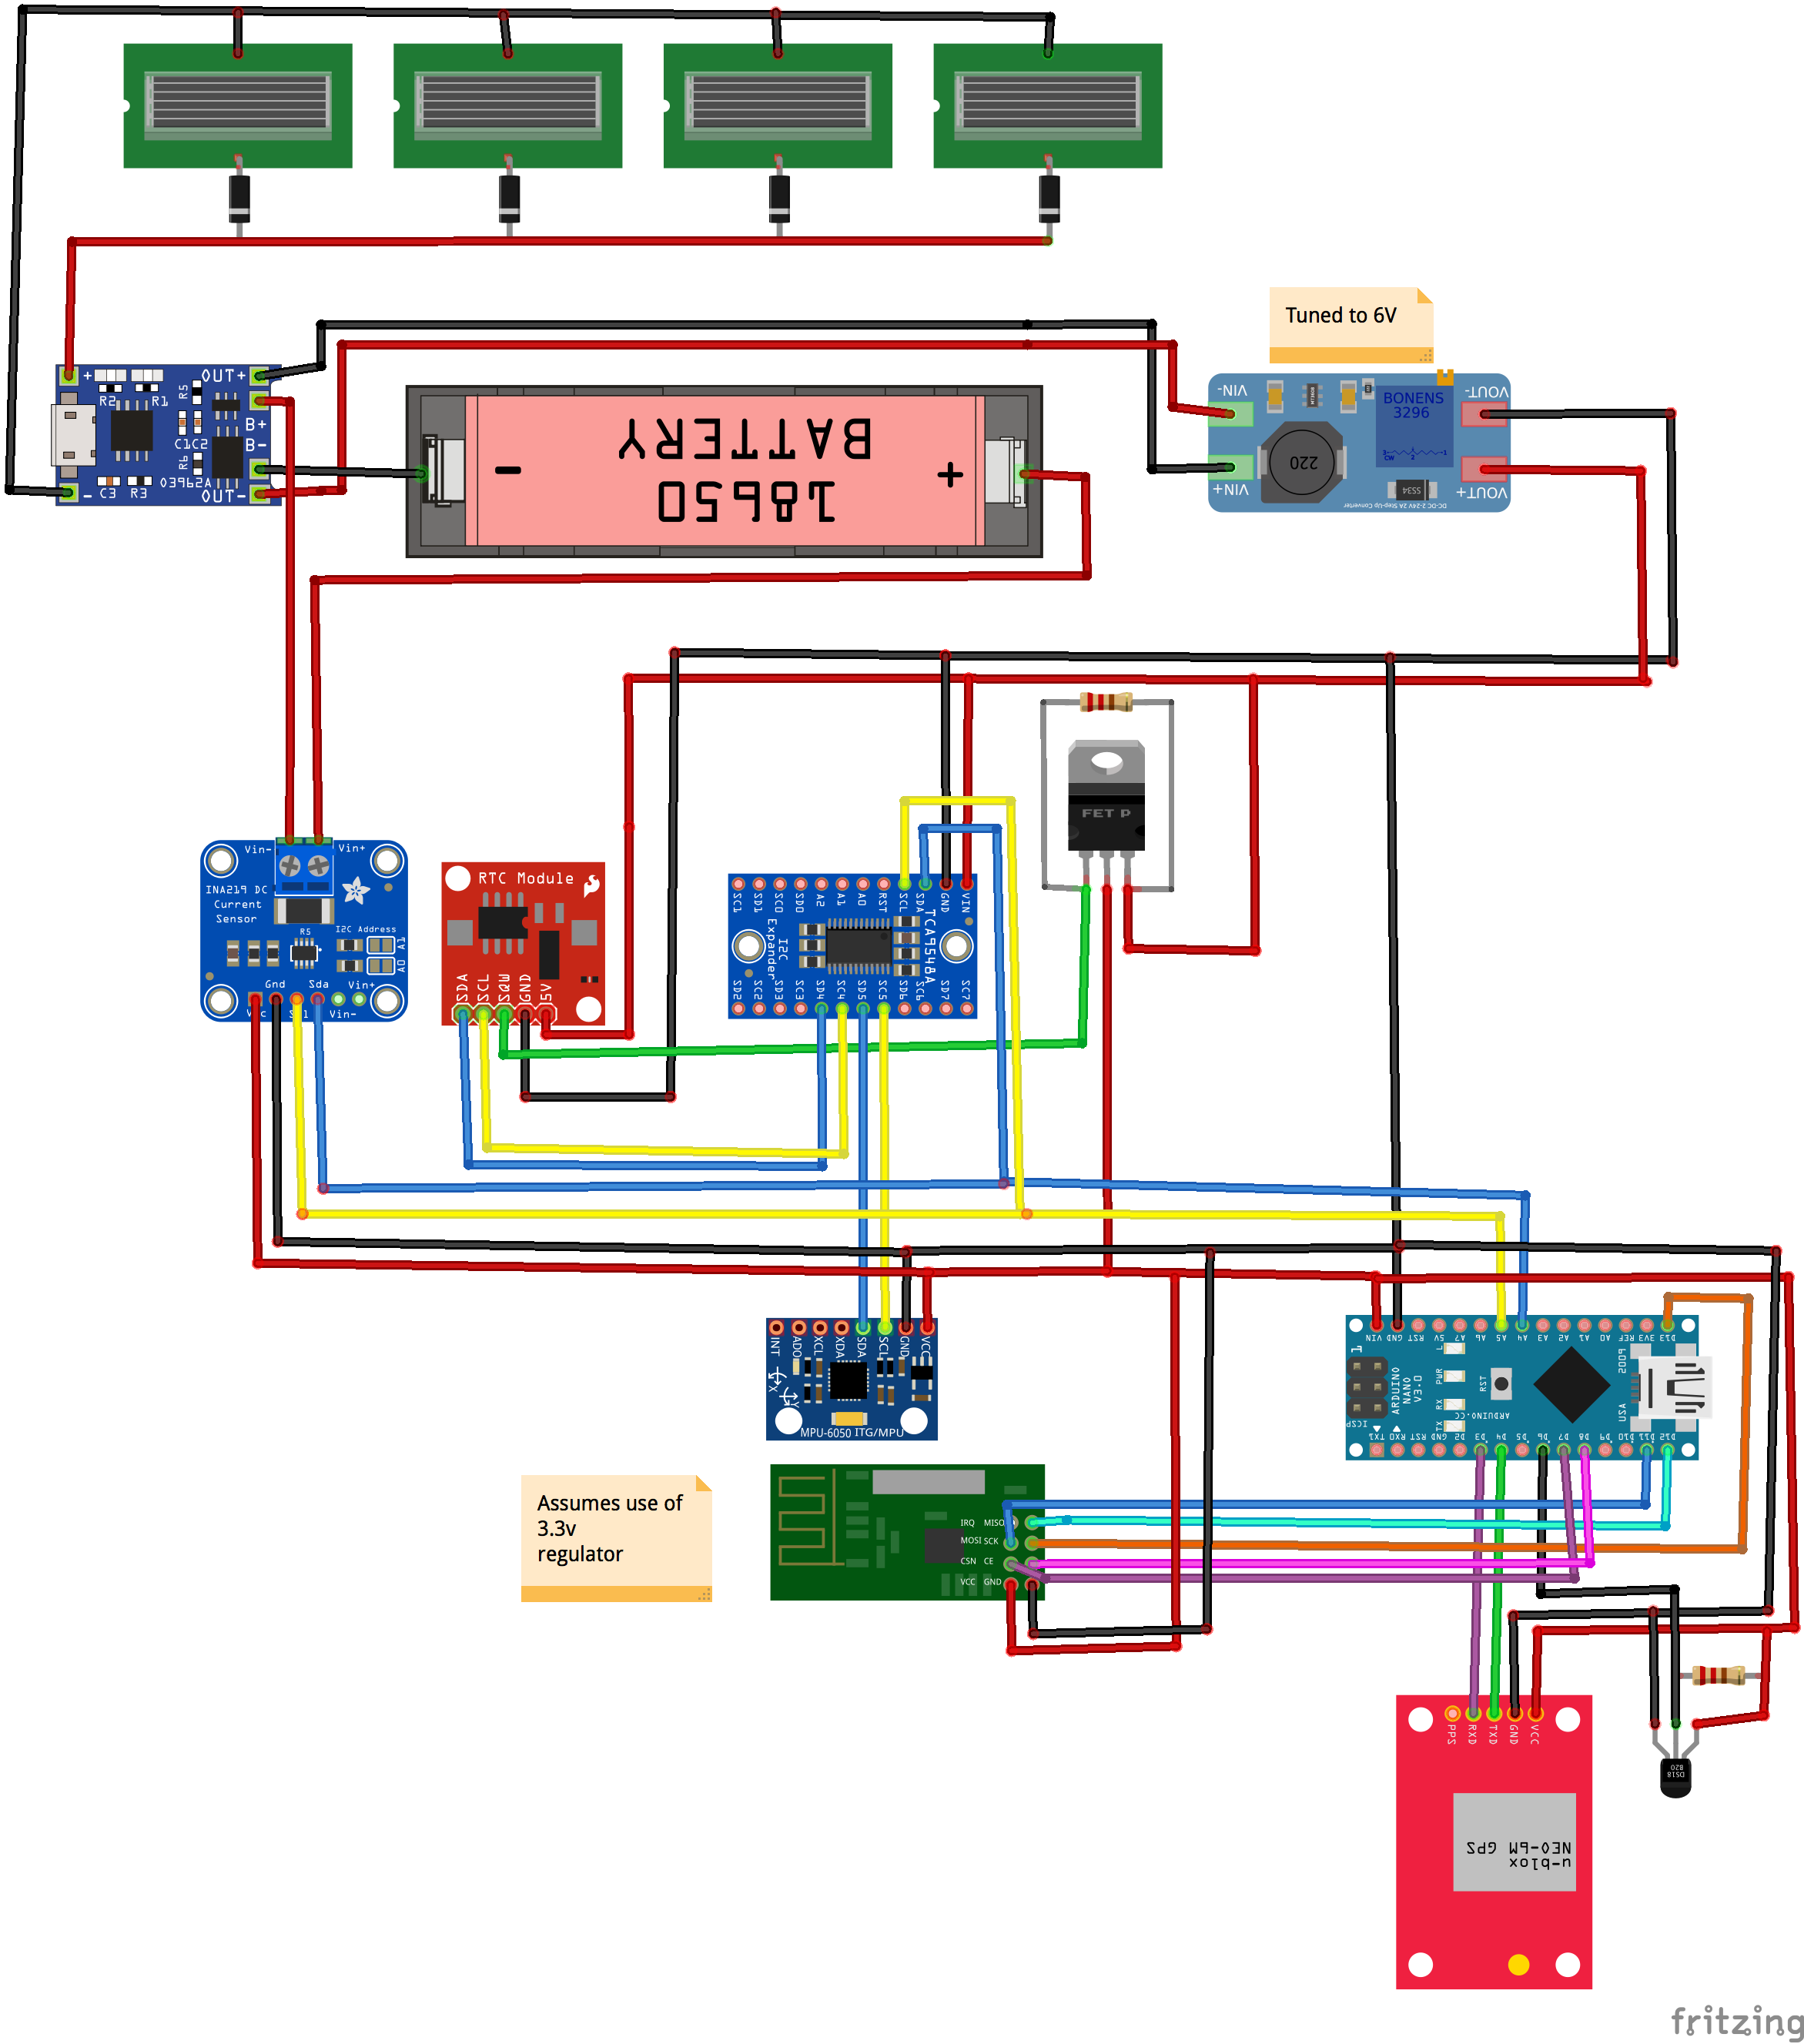
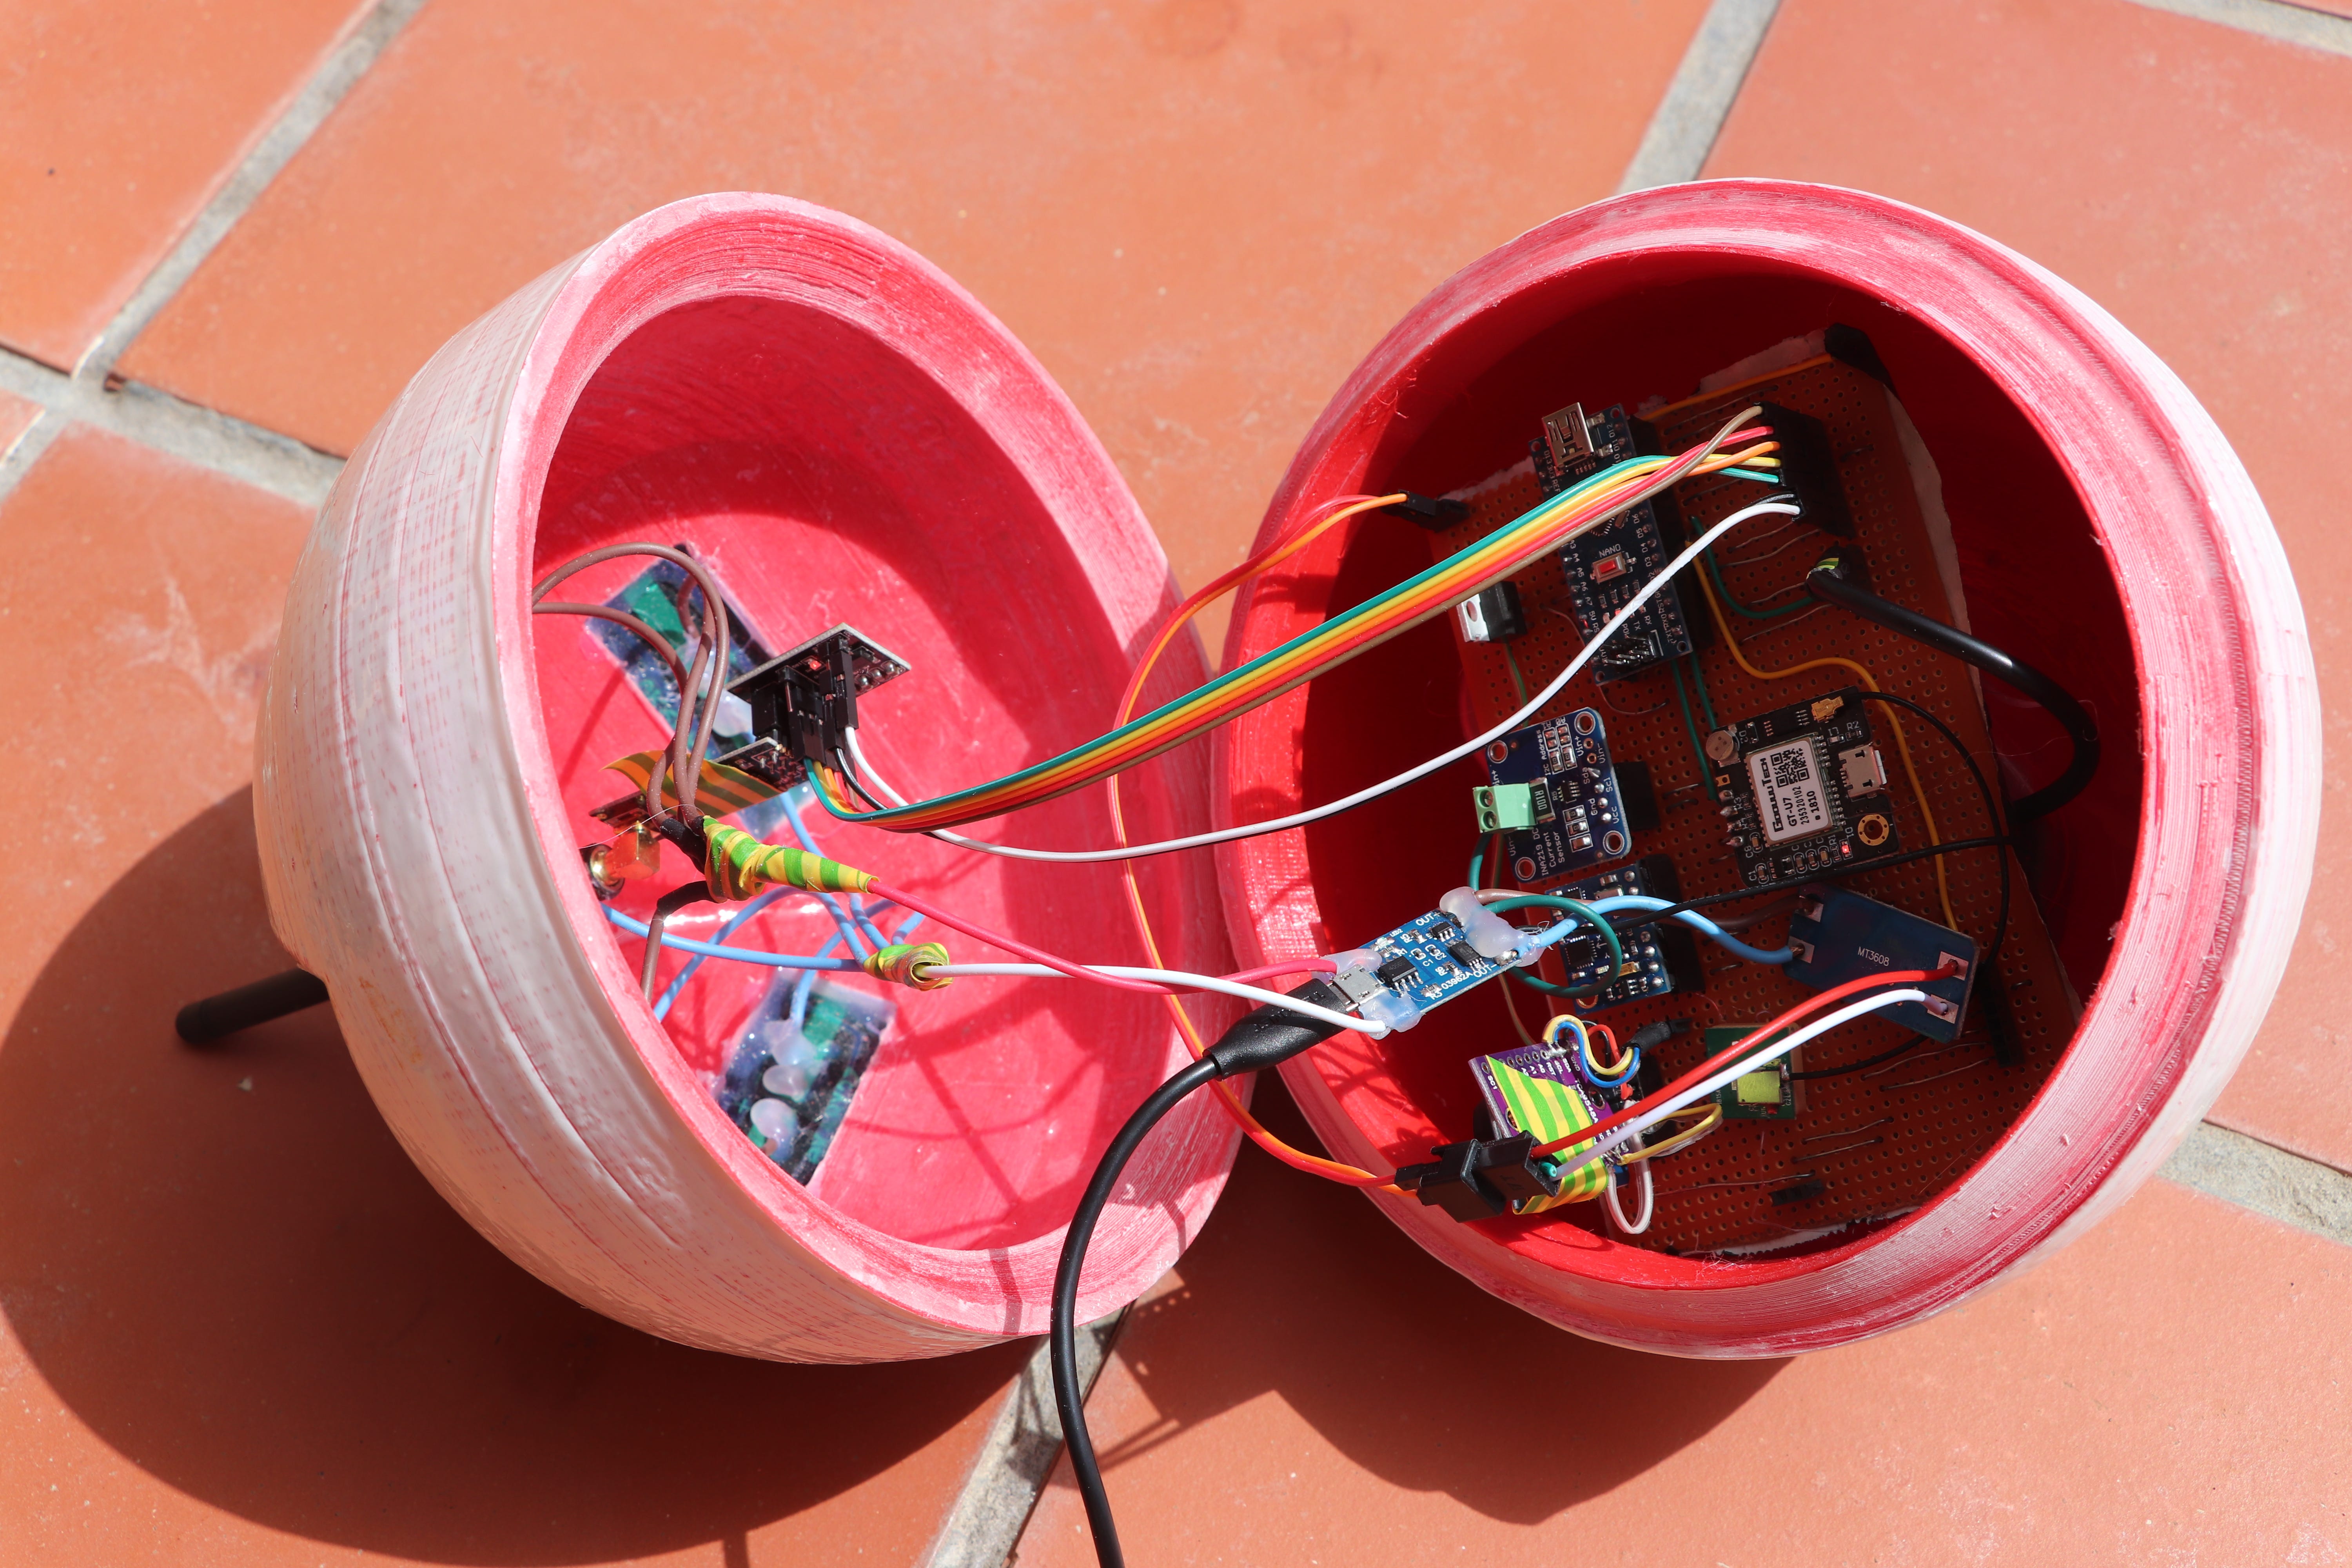
Motherboard — Perfboard
With a lot of determination, solder, and wire, we connected the electronics together on perfboard.
We pushed the radio aerial and water temperature sensors through their respective holes and glued them into position.
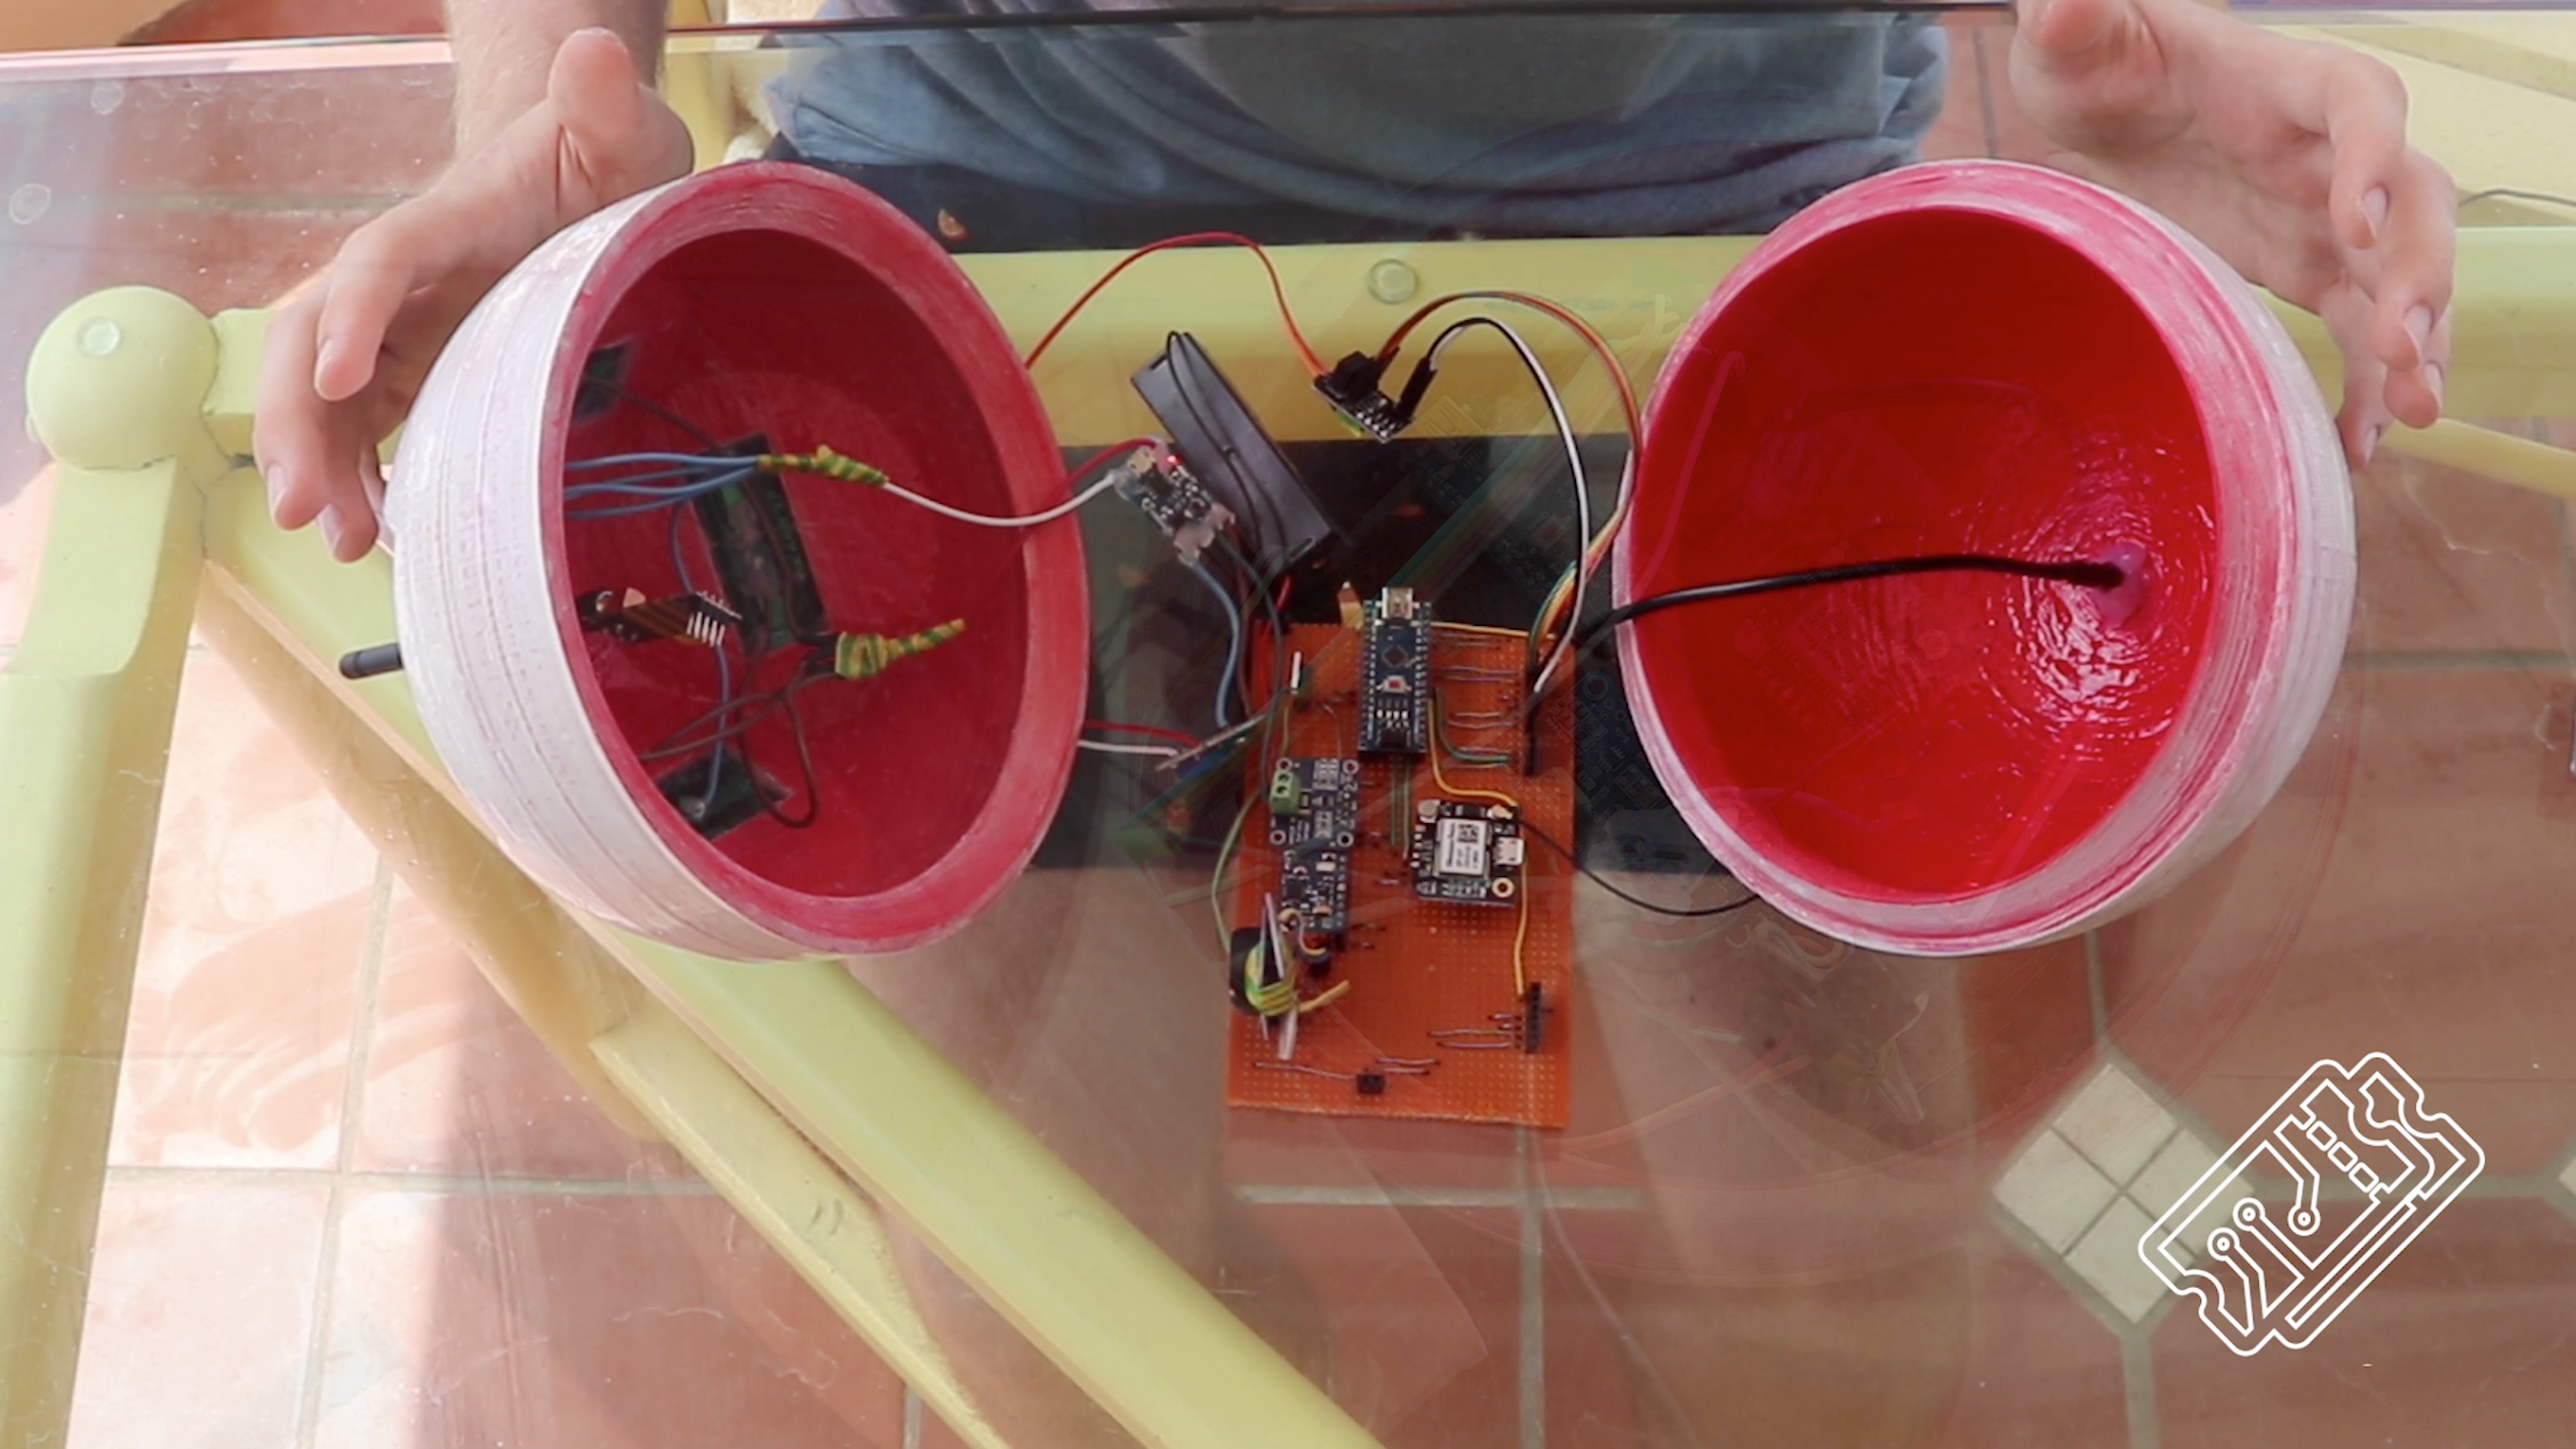
The perfboard slotted neatly into the Buoy and we glued it into position.
As we mentioned in tutorial two, we removed the SD card module because it was causing massive headaches.
Buoyancy
Logic (and probably science) dictated that the Buoy would float if it was less dense than the water. We believed the Buoy would float. But we didn’t have much trust in its stability.
Many of the buoys available to buy on the market are built such that they are self-righting. We opted for cutting a piece of pipe insulation and sticking it around the circumference of the middle of the Buoy. This had the bonus effect of making the Buoy look UFO-esque, and also potentially offered a bit of protection if any boats decided they wanted a closer look.
Base Station
With all the sensors on board the Buoy, we were able to measure: wave height, wave period, wave power, water temperature, air temperature, air pressure, voltage, current usage and location. These values were sent from the Buoy to the Base Station using the radio modules.
We would have loved to measure wave direction and we were super close to making it work, but it was a massive struggle (have a look at tutorial one to see our pain and confusion in more detail) so in the end we ditched it (please help ❤).
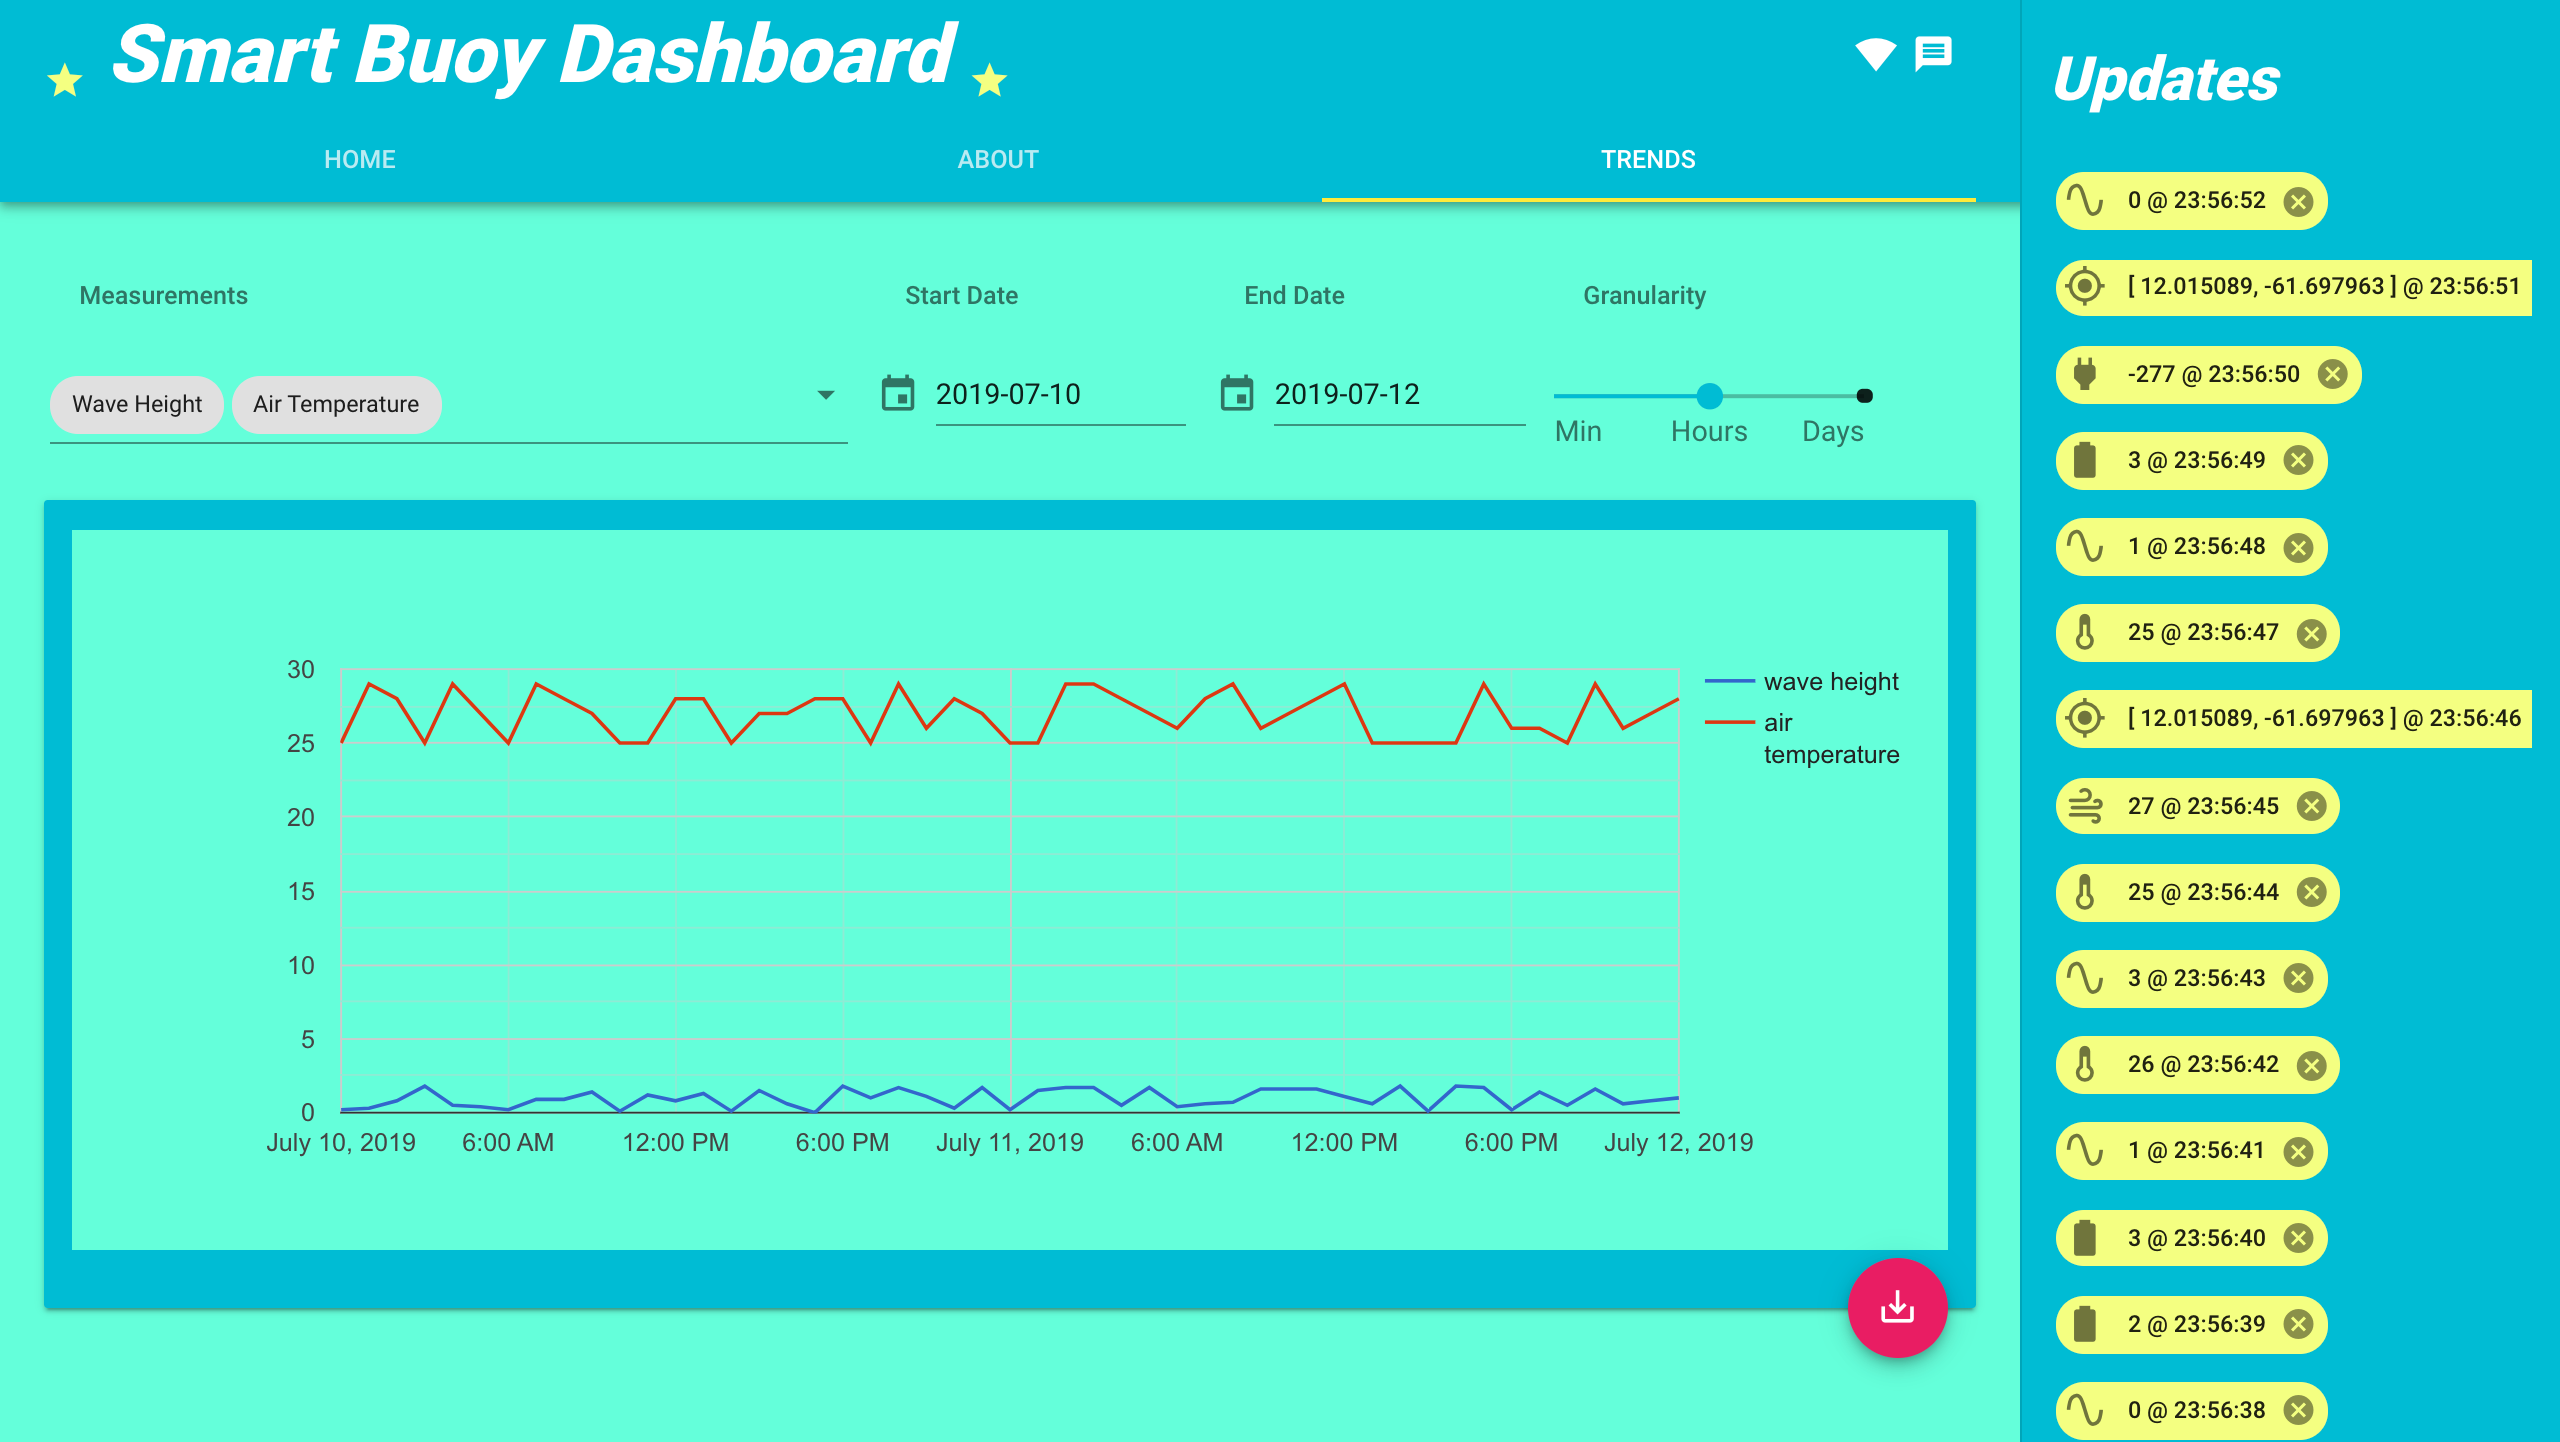
Dashboard
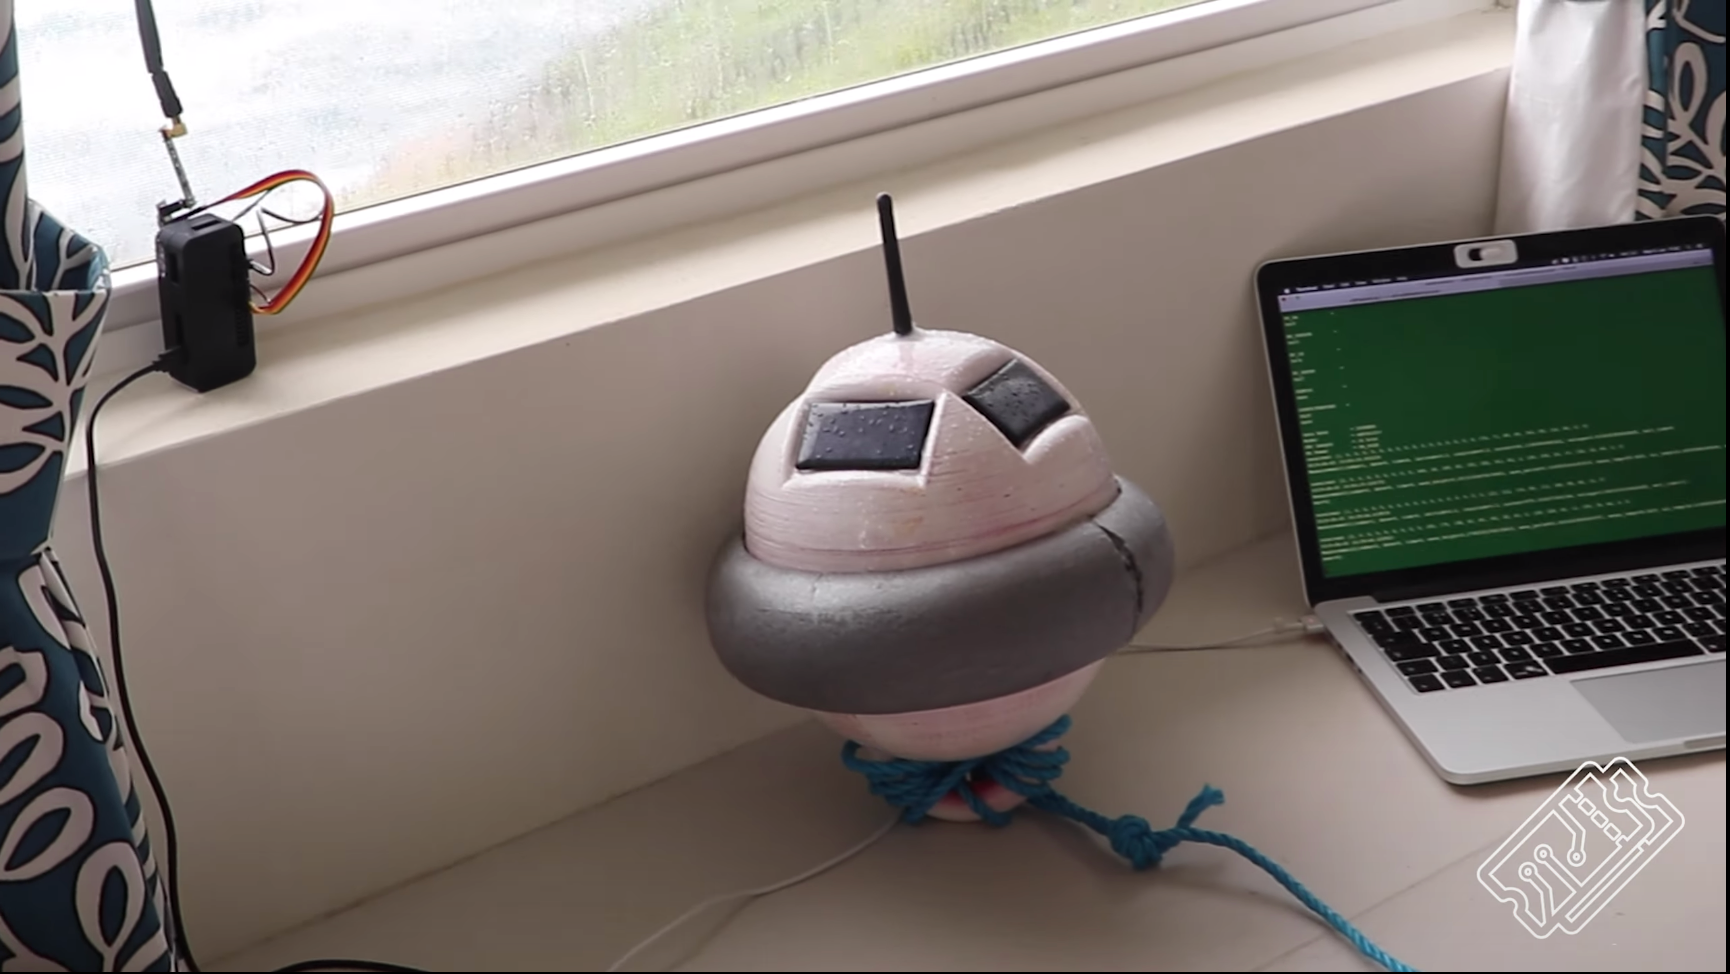
The Smart Buoy dashboard frontend was created using VueJs. We won’t explain is great depth how we did this, but we can show you how to get it going. Detailed steps can be found in the Github repo.
SSH into the Raspberry Pi base station
Install dependencies and create DB
Download code and the configuration file
env.jsonAdd Raspberry Pi IP address and Google Maps Key
Start the server
Once the base station begins radio communication with the Buoy, messages are stored in the database as well as streamed users of the real-time dashboard. Navigating to the dashboard home page in your browser, you should see the data streaming in.
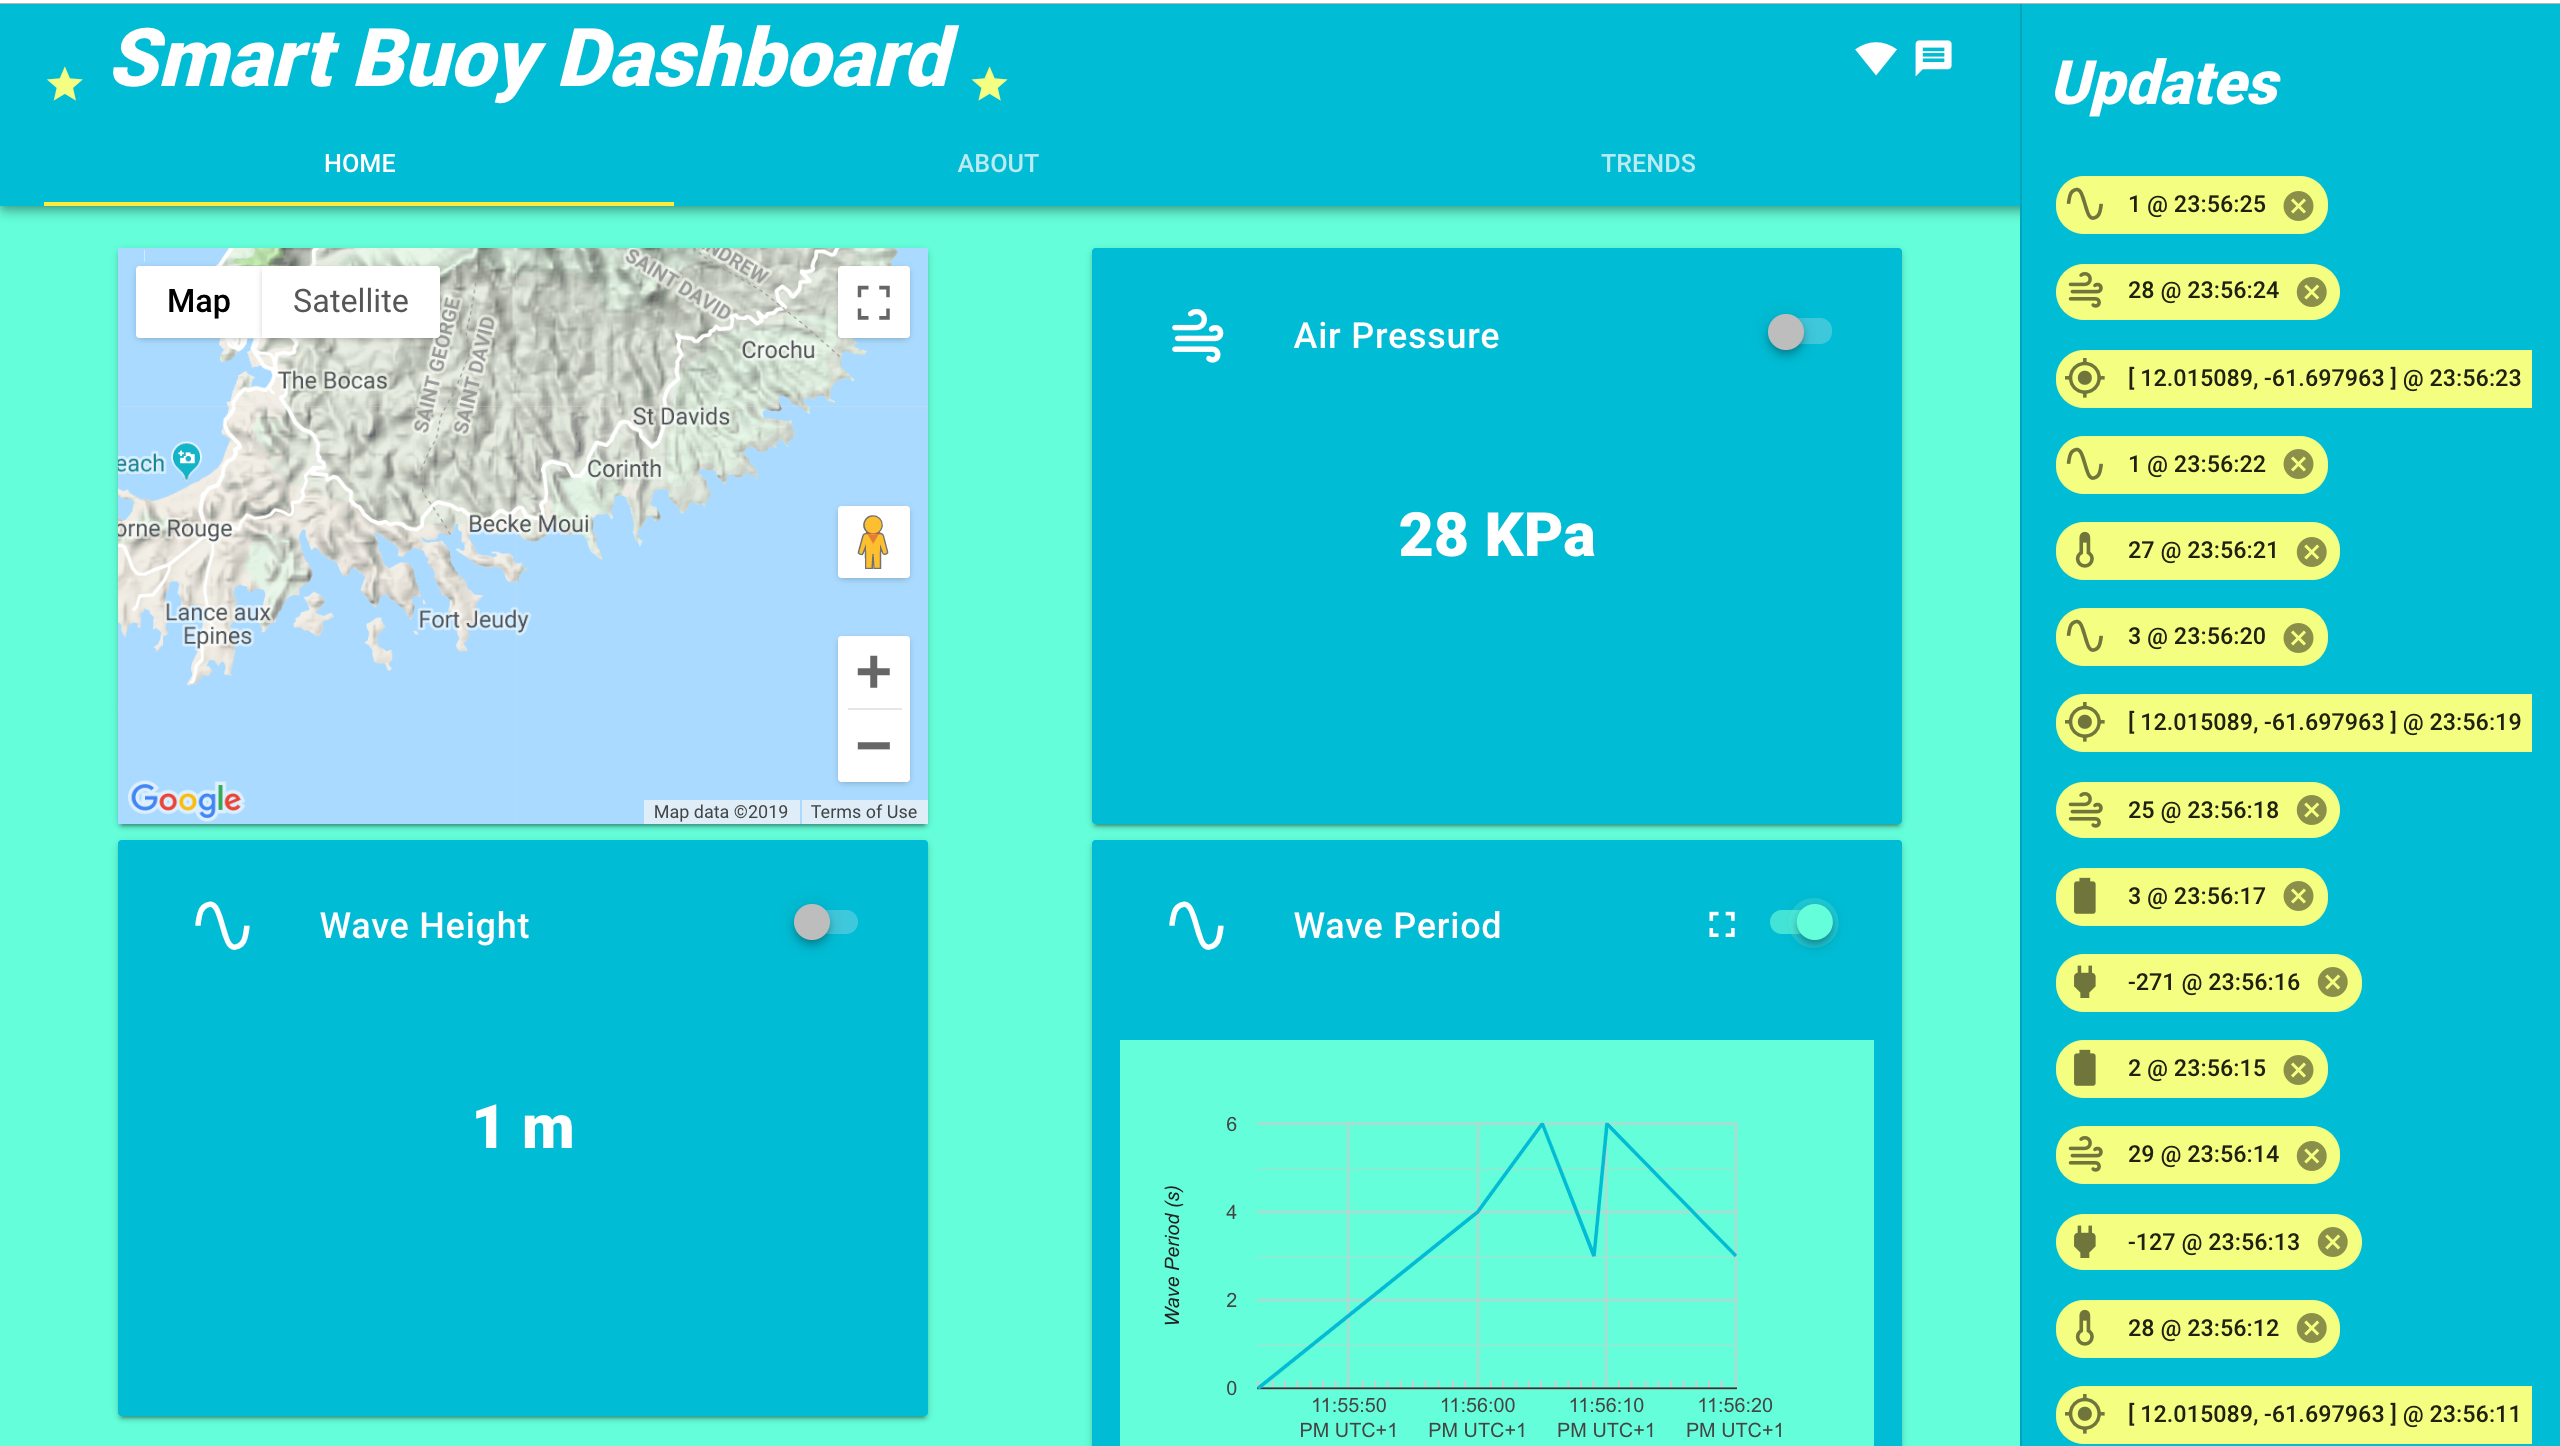
The time series of measurements can be viewed simply by toggling the view control on each measurement card. If you want a closer look at the data, the trends page features a graphing tool, which queries the database running on the base station.
Place — Where to put it?
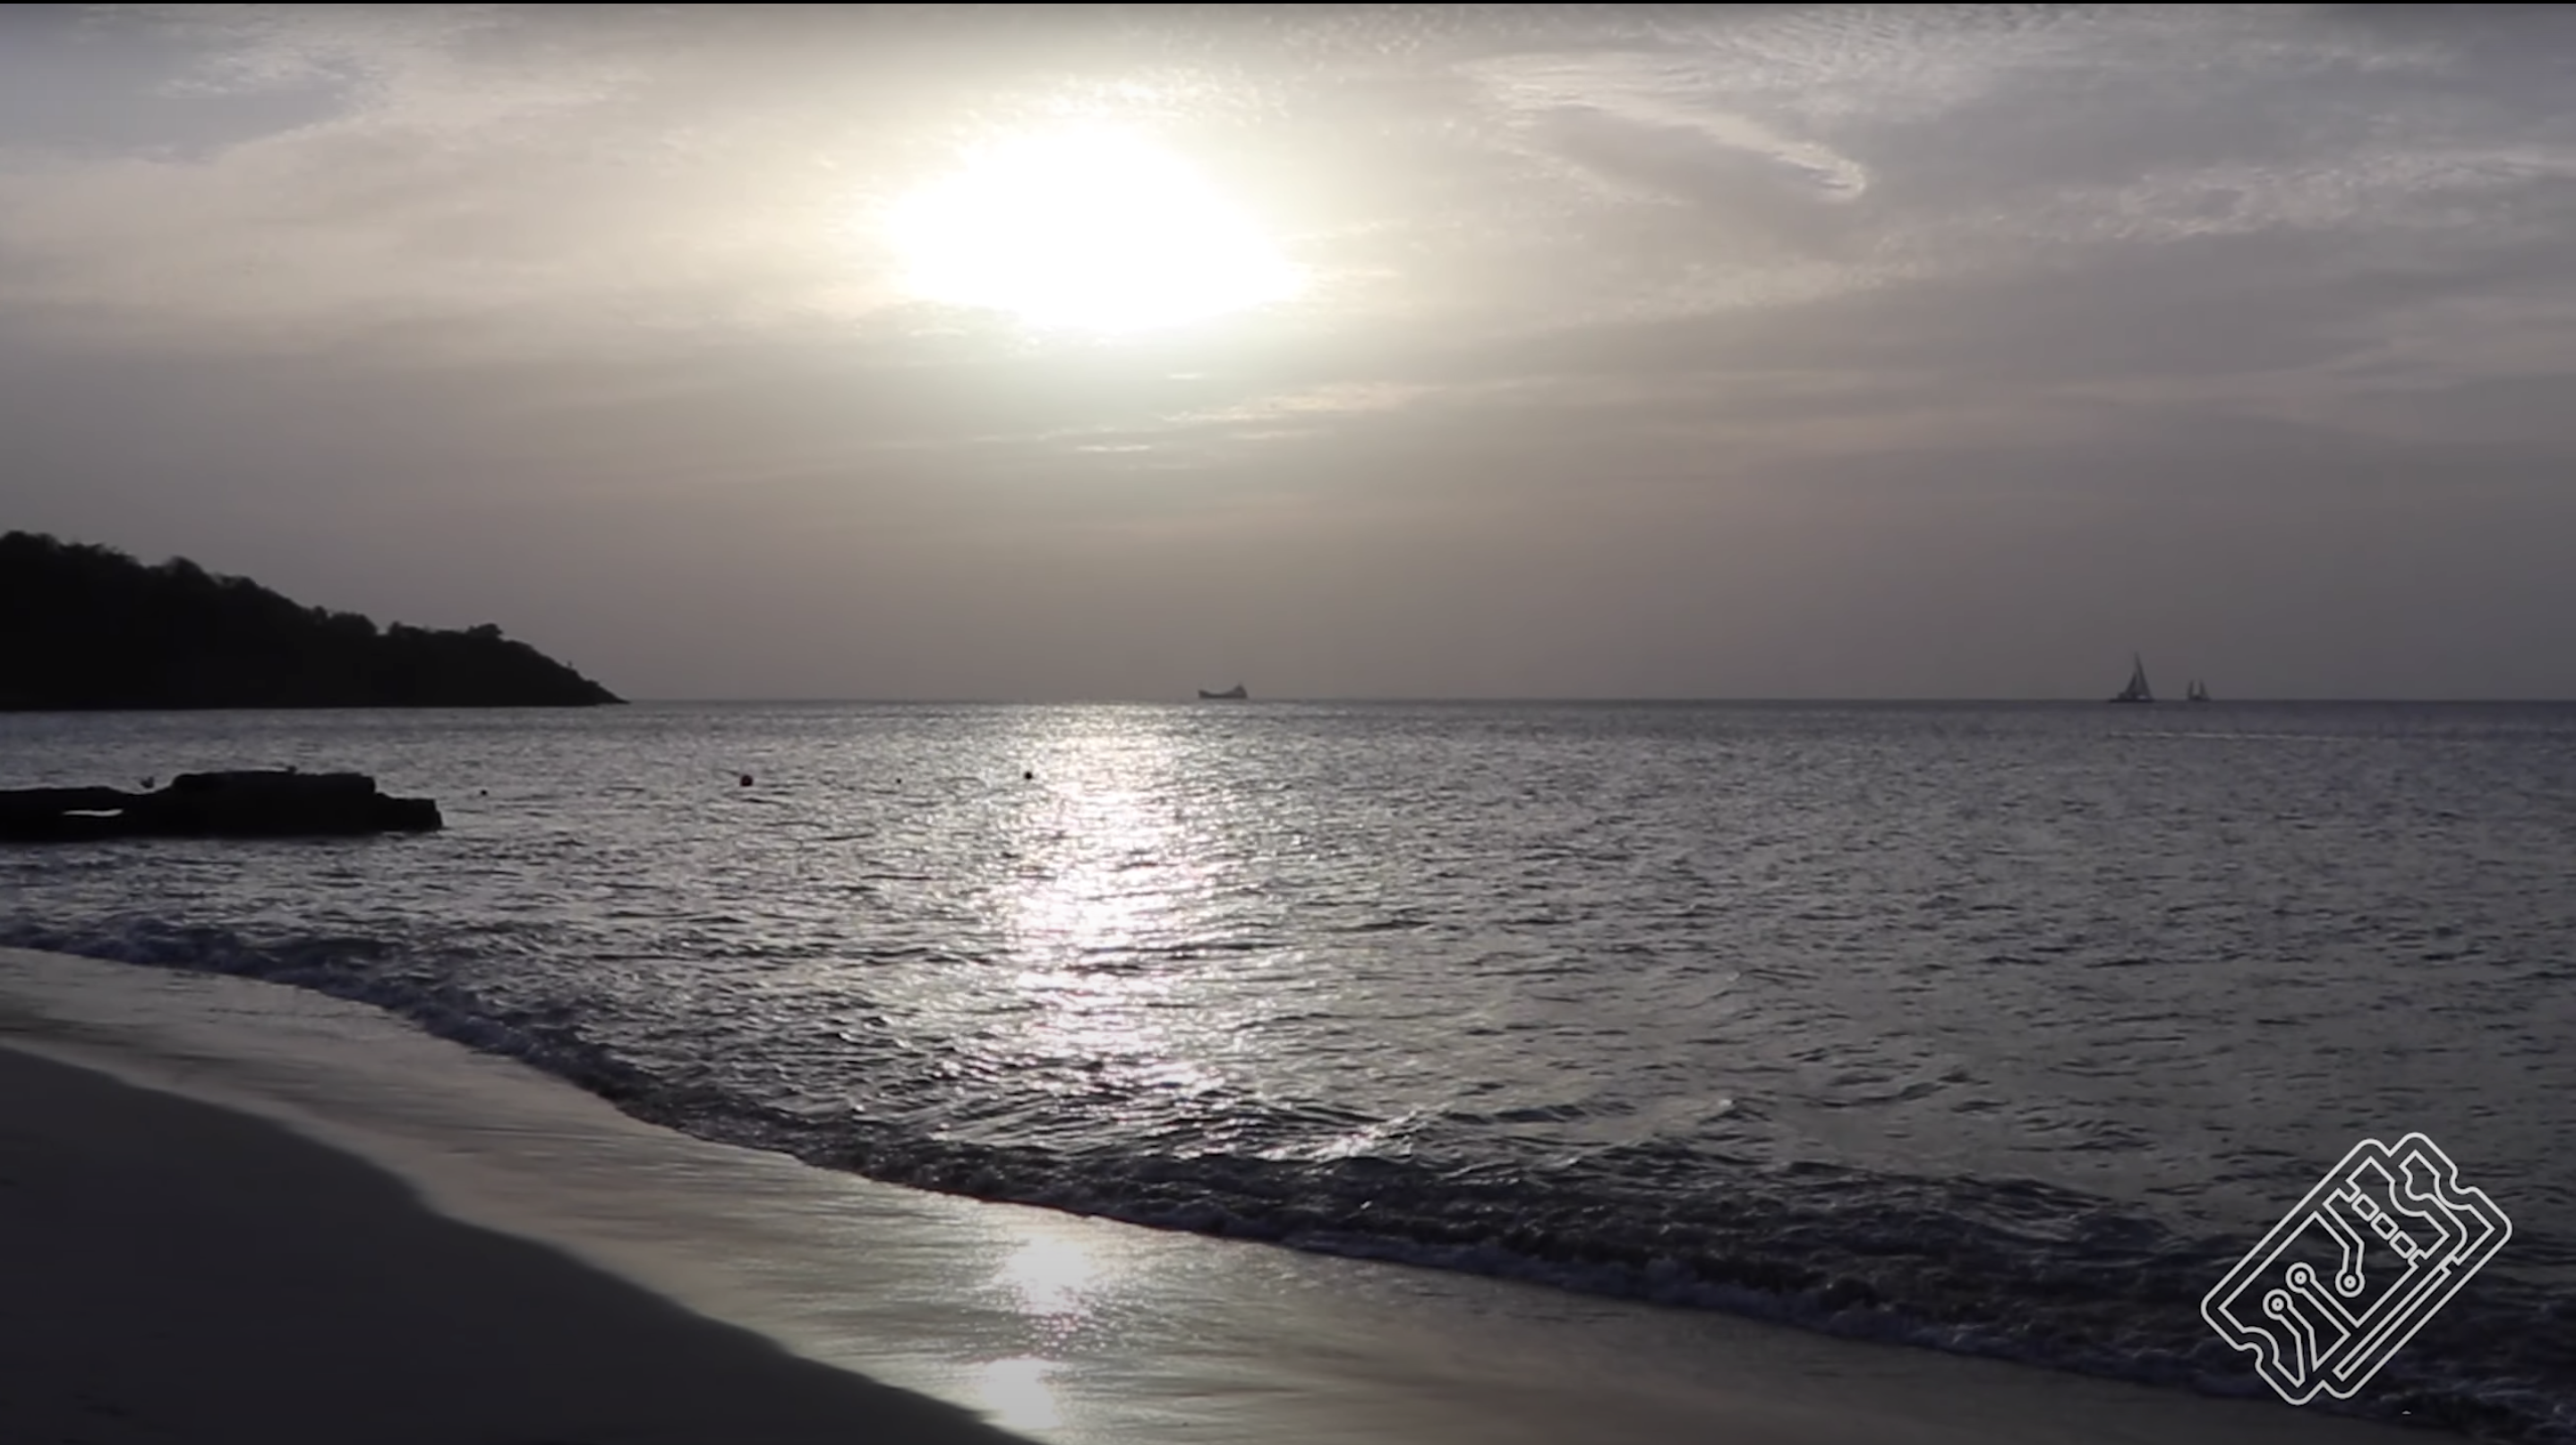
Grenada is a wonderful island in the South Caribbean. The east coast, which faces the Atlantic, typically receives more wave energy than more sheltered western side. The tidal range (distance between high and low tide) is small, meaning the effects of sea level rise are more acutely felt. The increasing frequency and intensity of tropical storms in the Caribbean also poses a worrying threat, and major storms can cause significant damage to coastal areas.
Anyway, enough of that. We looked for somewhere to initially deploy the Buoy, taking into account our knowledge of the island and its coastal regions. An ideal spot needed small but dynamic waves, few rogue fisherman, and be easy for to access… So we initially tested in the pool.
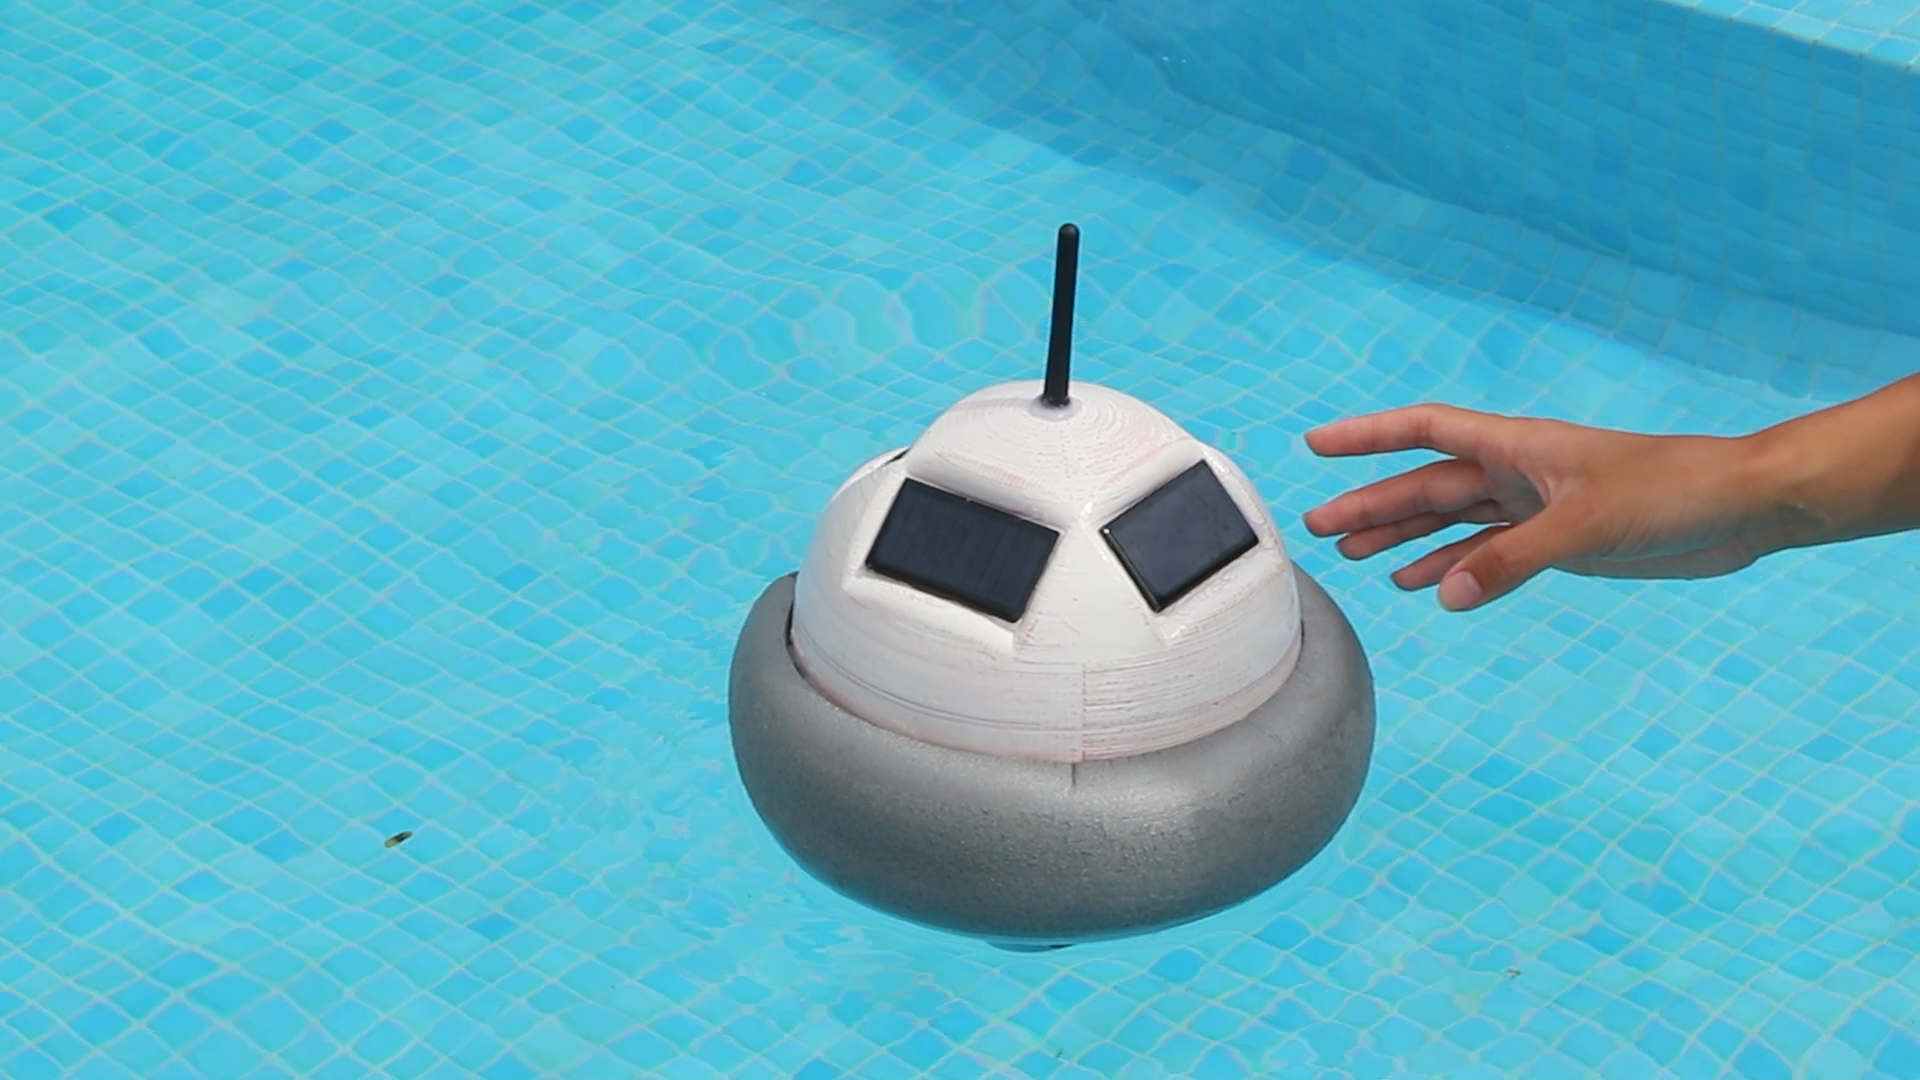 *
*
Test Location — Pool*
While in Grenada, we also had the chance to talk with a friend who owns a beachfront dive shop. He has his own environmental mission — to create an artificial coral reef — which you can read more about here. We were delighted when he gave us permission to attach our Buoy to one of this lines.
We anchored the Buoy to some others by knotting a piece of rope around the bottom side hook (yes, we’re pretty legit). It didn’t sink. IT WORKED!
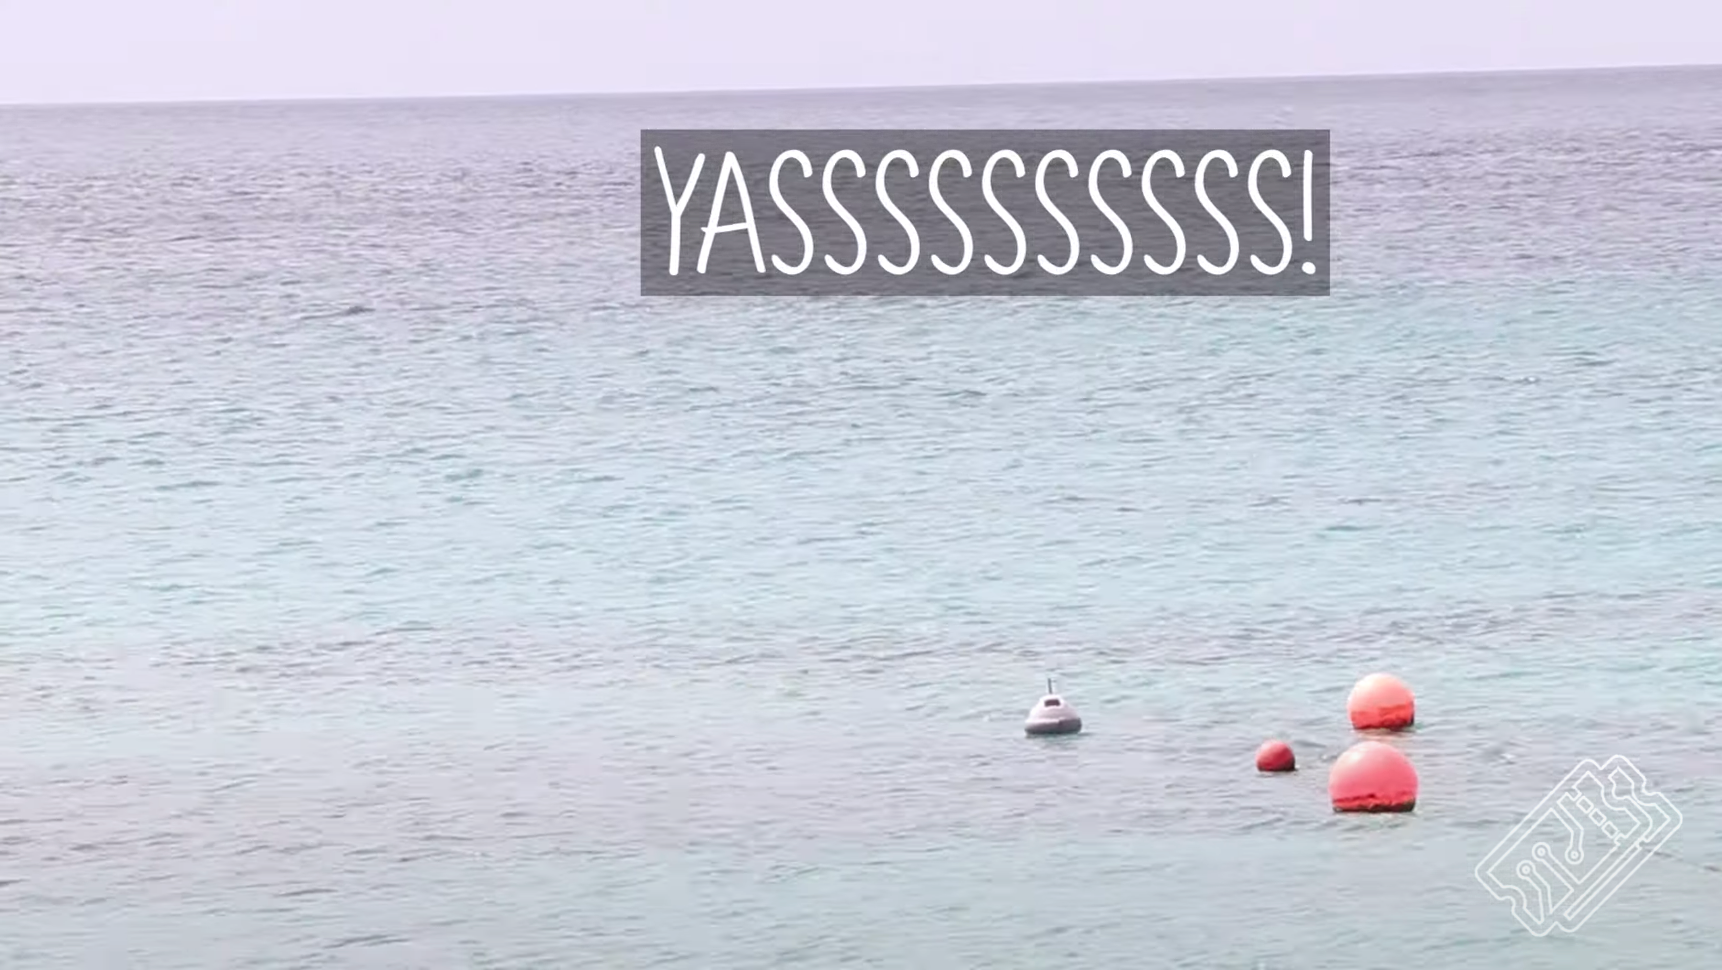 *
*
Test Location — Sea*
V2
The Smart Buoy project has been a great source of learning. We are very happy with the system we have managed to create, especially considering the (self-imposed) time and cost constraints.
However, the Buoy’s purpose was to take meaningful ocean measurements. We only managed to get the Buoy working a few days before we had to leave sunny Grenada. Back in the UK, the seaside is slightly less alluring…Not to say this project won’t continue. We’ve learned a lot, and now we can apply these improvements and hopefully go on another wonderful journey.
Top Improvements
Ability to open and reseal the Buoy
LoRa ESP32 to replace Arduino in Buoy
Data processing on wave measurements on the Buoy
Thanks for Reading
Part 1: Making wave and temperature measurements
Part 2: GPS, Radio (NRF24) and SD Card Module
Part 3: Scheduling Power to the Buoy
Part 4: Waterproofing, Dashboards and Deploy!
We hope you enjoyed this article. If you like the style, check out T3chFlicks.org for more tech-focused educational content as well as all the fun stuff we do on YouTube (Instagram, Facebook, Twitter).


